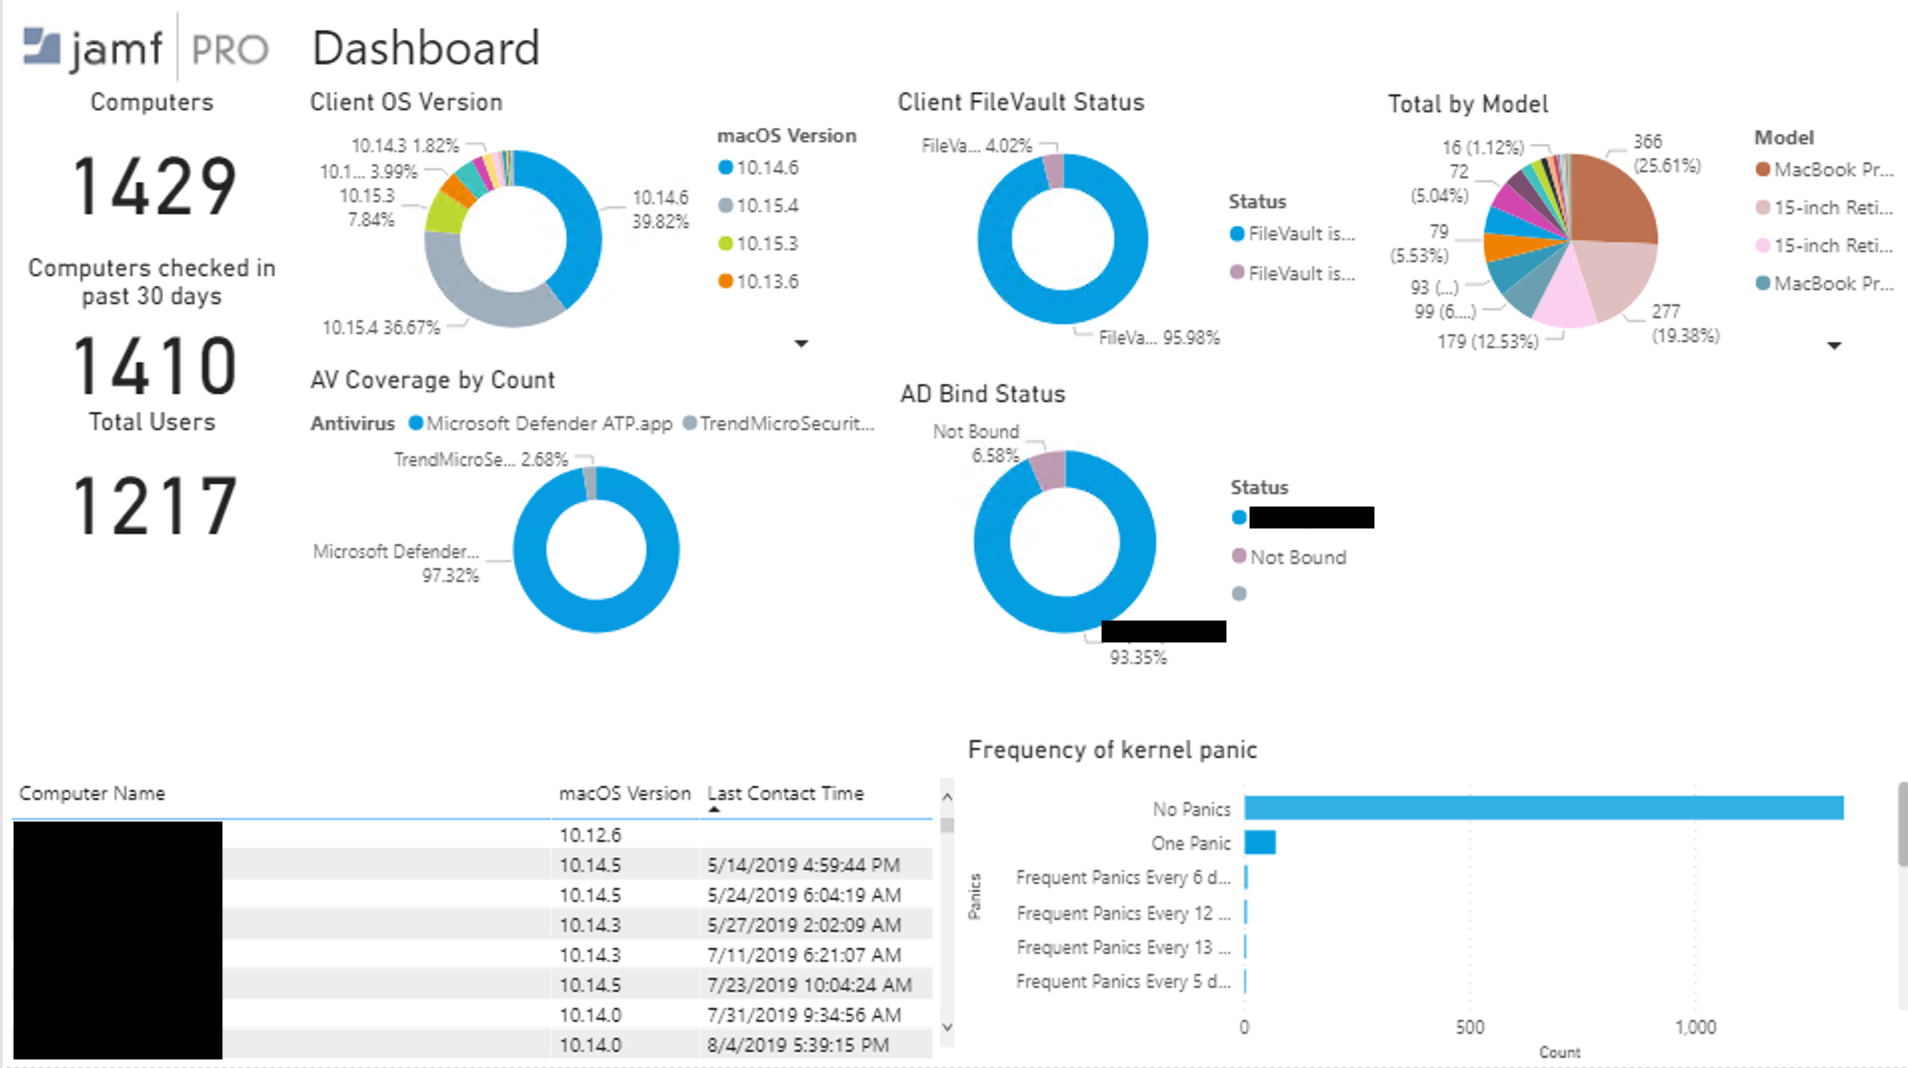
Jamf Pro has built-in dashboards, but many admins want the flexibility of Business Intelligence (BI) or reporting tools. JNUC 2019 introduced integrations with some of the most popular tools. We have been hard at work creating resources to help you get the most out of your data, and now we want to see your dashboard!


If you have a great dashboard to share, please post it here! If you have tips or tricks that helped you build it, share it with your fellow admins. Remember to sanitize any sensitive data before posting.


Integrating Jamf with Splunk

Oh that was to simple for me😂. Thank you...

Have you found a way to activate the autoupdate for the reports on the web?


Hi Colorenz

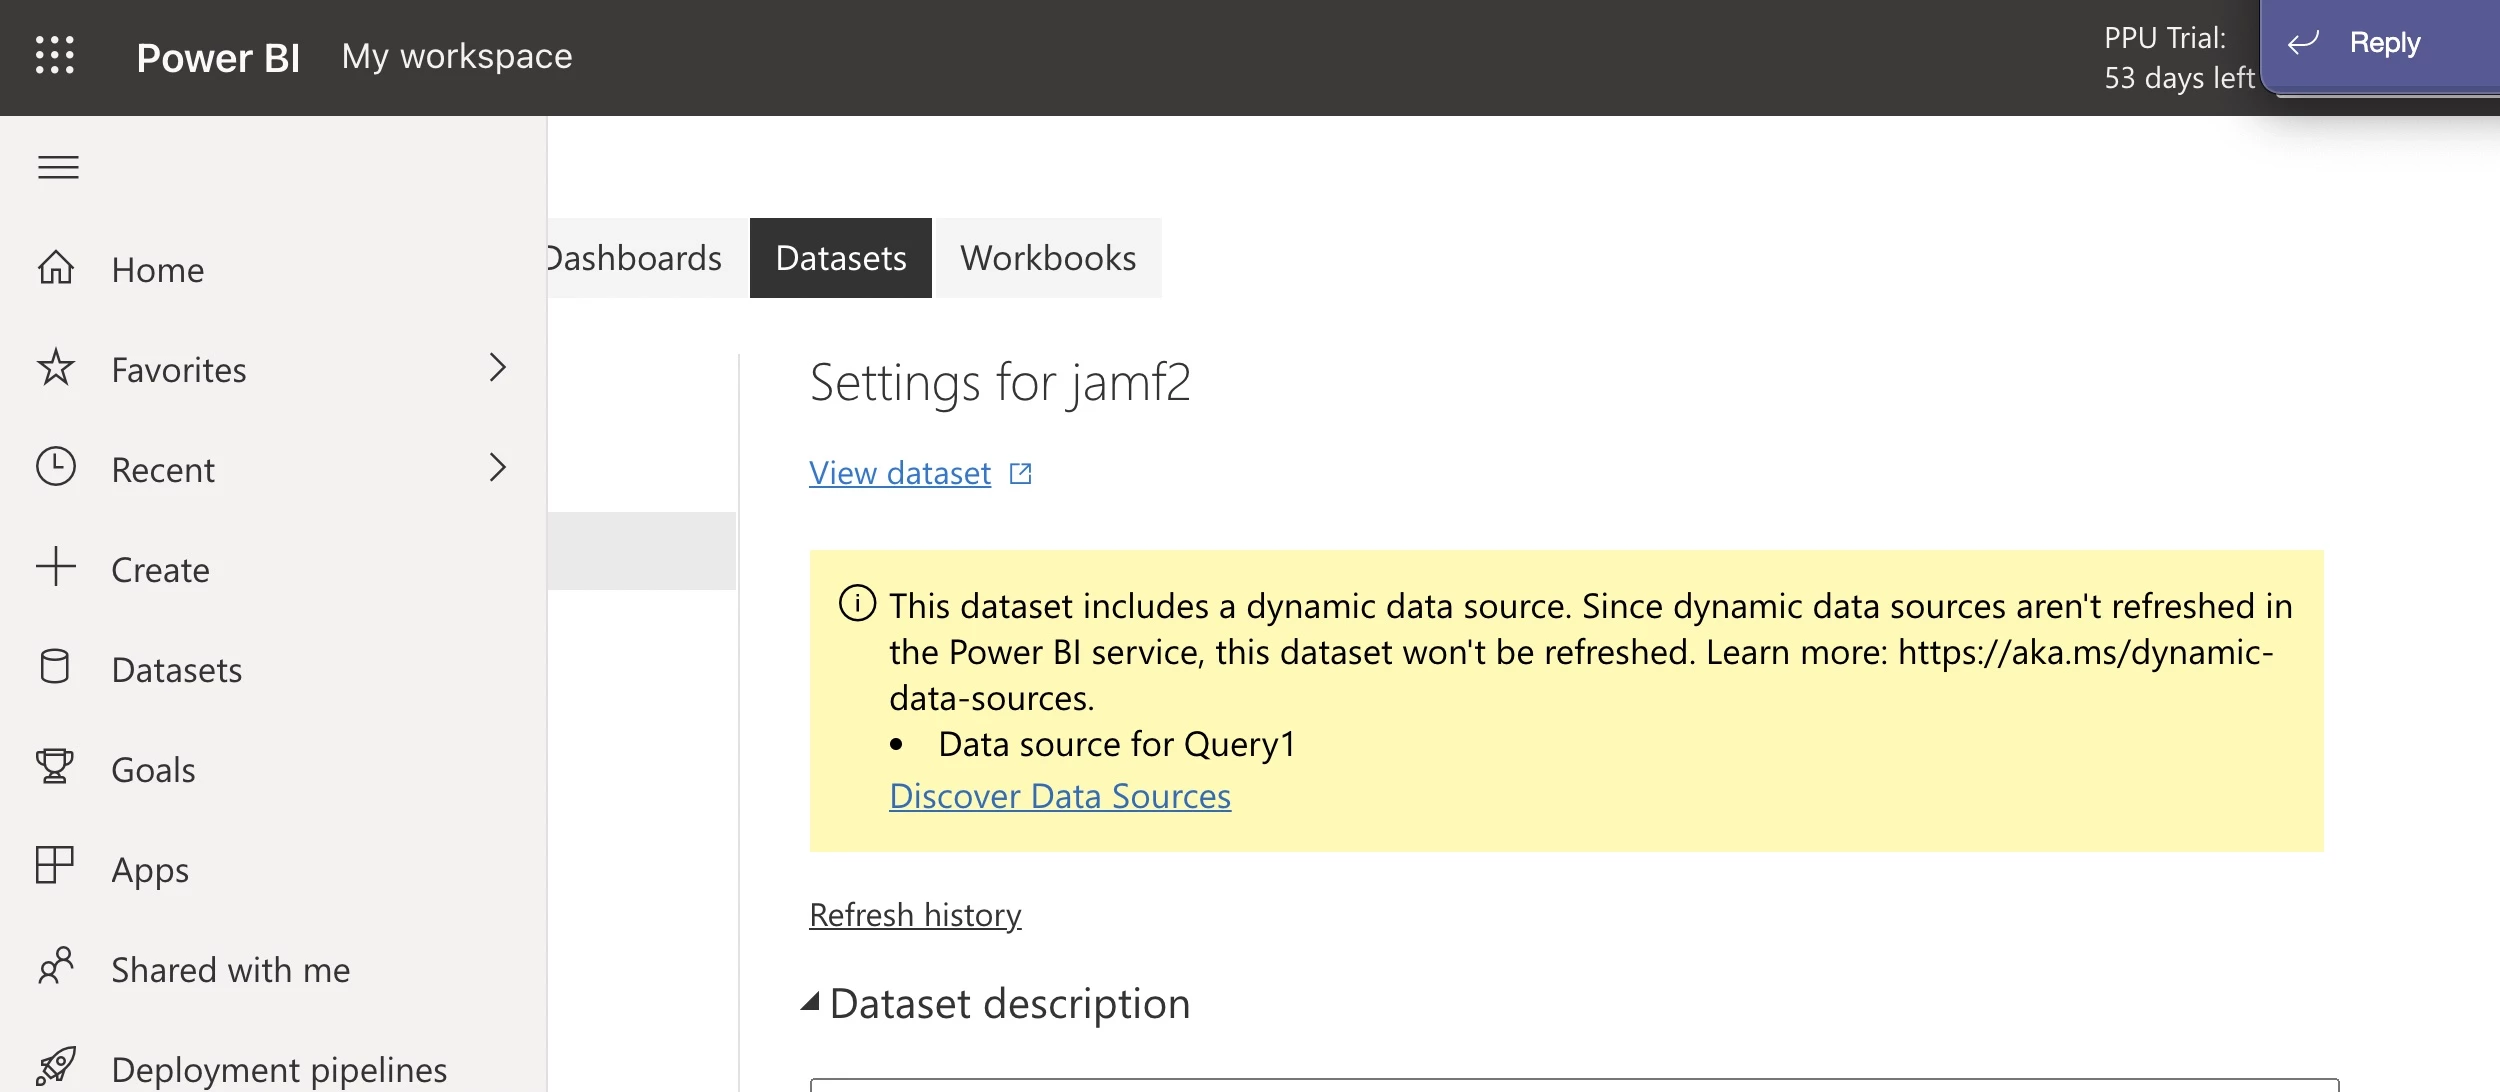
Just setup a Power BI gateway server. Once done you will be able to automate the data refresh of Jamf datasource

Here's the link to download Power BI gateway server and instructions
https://docs.microsoft.com/en-us/power-bi/connect-data/service-gateway-onprem

[cid:image001.png@01D7CE74.FA9A66B0]

Here is our PowerBI view, inspired by all your dashboards. I would like to make a graph of the deployment of Monterey over time, but I feel like it's another level. Might be easier with Splunk.


Here is our PowerBI view, inspired by all your dashboards. I would like to make a graph of the deployment of Monterey over time, but I feel like it's another level. Might be easier with Splunk.


To achieve that, I would recommend possibly doing a webhook which calls on a function or application that then writes to a database and then pull from there. An example might be: Smart Group named "Monterey" then a webhook that is called when "Membership changes". This webhook calls on a Power Automate flow which only runs if a machine is added to the group. This automation will write to a Sharepoint List with the date and the serial number. You can then pull that list and make a relationship on the Serial Number between the Computers data and the Monterey Serial data.


Hi Guys, looking at some of the cool stuff you have here I wanted to reach out and find out has anyone done anything with google data studios am trying to do the same dashboard reporting as you guys but haven’t found a way of getting the data over to Data studio to create these any help or tips would be very appreciated. Thank you  


Hi Guys, looking at some of the cool stuff you have here I wanted to reach out and find out has anyone done anything with google data studios am trying to do the same dashboard reporting as you guys but haven’t found a way of getting the data over to Data studio to create these any help or tips would be very appreciated. Thank you  


A simple "csv" data upload might be a good place to start. Jamf Pro can export Computer or Mobile Device information via the Advanced Search feature and you can upload those to Data Studio as a Data Source. 


There's a more verbose version of Jamf's Splunk Integration Guide available on Github. It goes into things like integrating data from multiple sources and more step by step on building searches than we wanted in the product documentation. And lots more screen-shots. :)

There are also some scripts there to pull things like mdm command history and application usage data that need some transformations that we haven't yet built into the standard plugin, and complete dashboards you can download as source code that you can just copy-paste into your Splunk. We'd love to see others share their dashboard code as well.

For those using PowerBI, this non-Jamf Blog is very helpful.


@oliver11_2 can you post the verbose guide again as I can’t find it and the link is a 404


@oliver11_2 can you post the verbose guide again as I can’t find it and the link is a 404


Link updated.


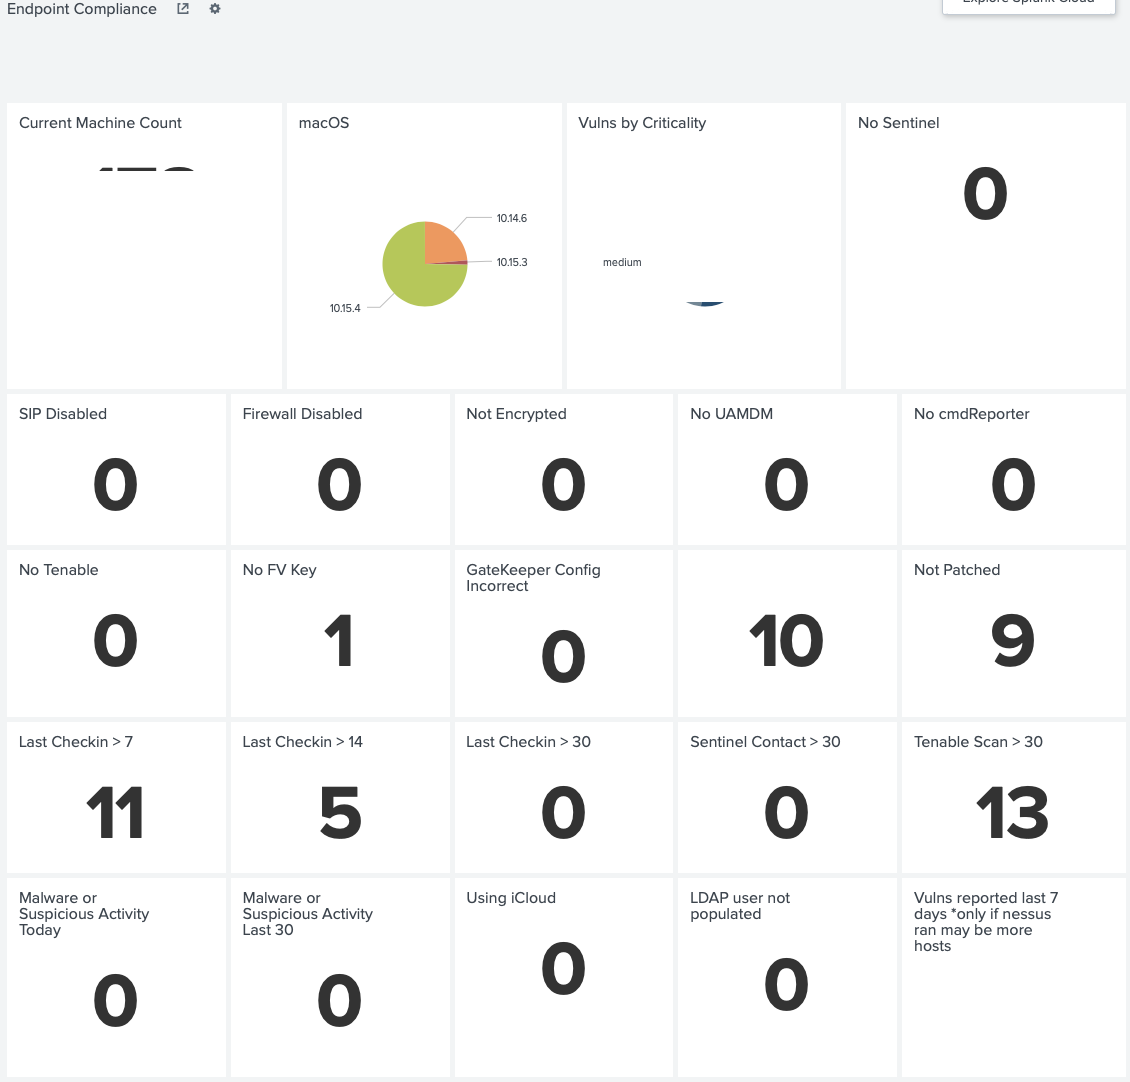
One of our dashboards... with redactions


I have a couple of questions for you. How did you get the Tenable and "Not Patched" information?


Tangentism, please see this doc and Lisa/Kevin's JNUC 2020 Splunk presentation for some examples. There are some example dashboards in the same repo as the pdf doc. If you scroll up in this thread there are some super slick d-boards from DBrowning and LisaCherie. But you might go at this from a different angle... think about what issues your device management program is being asked to address and how data and visualizations might be used to provide meaningful insights or active monitoring. Then go from there.


This doc has moved to https://github.com/jamf/ol/tree/master/reporting/splunk/doc/img


Here is one that I have been working on that is still growing. I'm using PowerBI for the reports using the published Jamf Pro PowerBI connector.


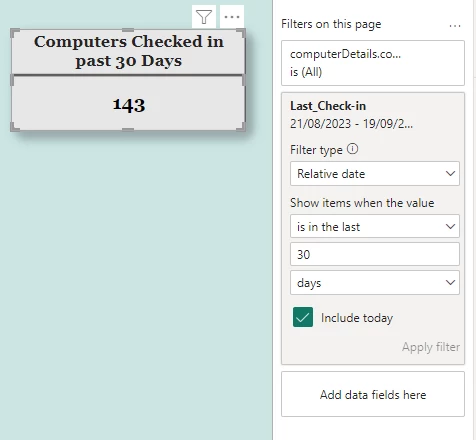
Hi, can you help me on computers checked in 20 days report as im struggling. I am using conector to connect Jamf on Powerbi.


Hi, can you help me on computers checked in 20 days report as im struggling. I am using conector to connect Jamf on Powerbi.


I think i have managed to get the filter. Looks like it is working but not sure if it is showing same devices checked in or not. 


I think i have managed to get the filter. Looks like it is working but not sure if it is showing same devices checked in or not. 


I think I have managed to add the filter but when i add all computer count, it is showing same as last checked in filter.


I think I have managed to add the filter but when i add all computer count, it is showing same as last checked in filter.


How have you been able to see the filter type for the relative date? I do not have this option.


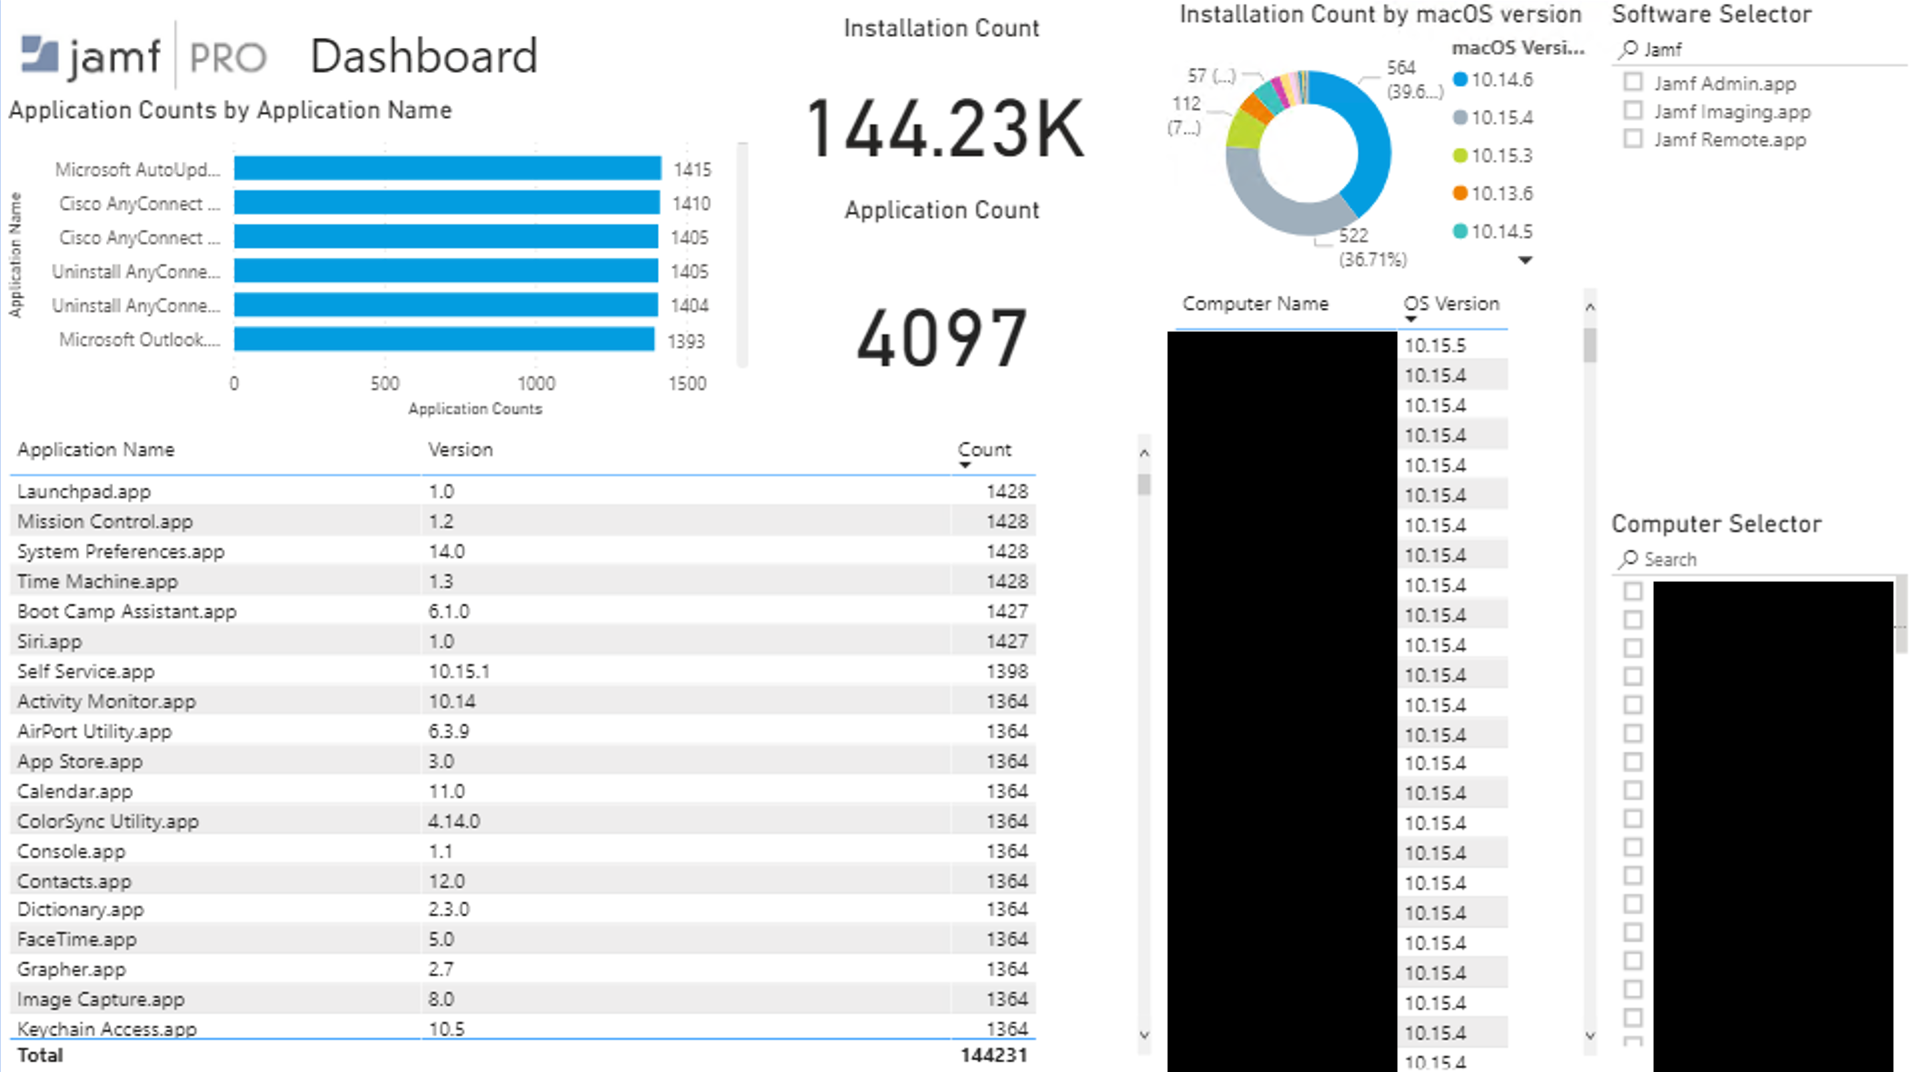
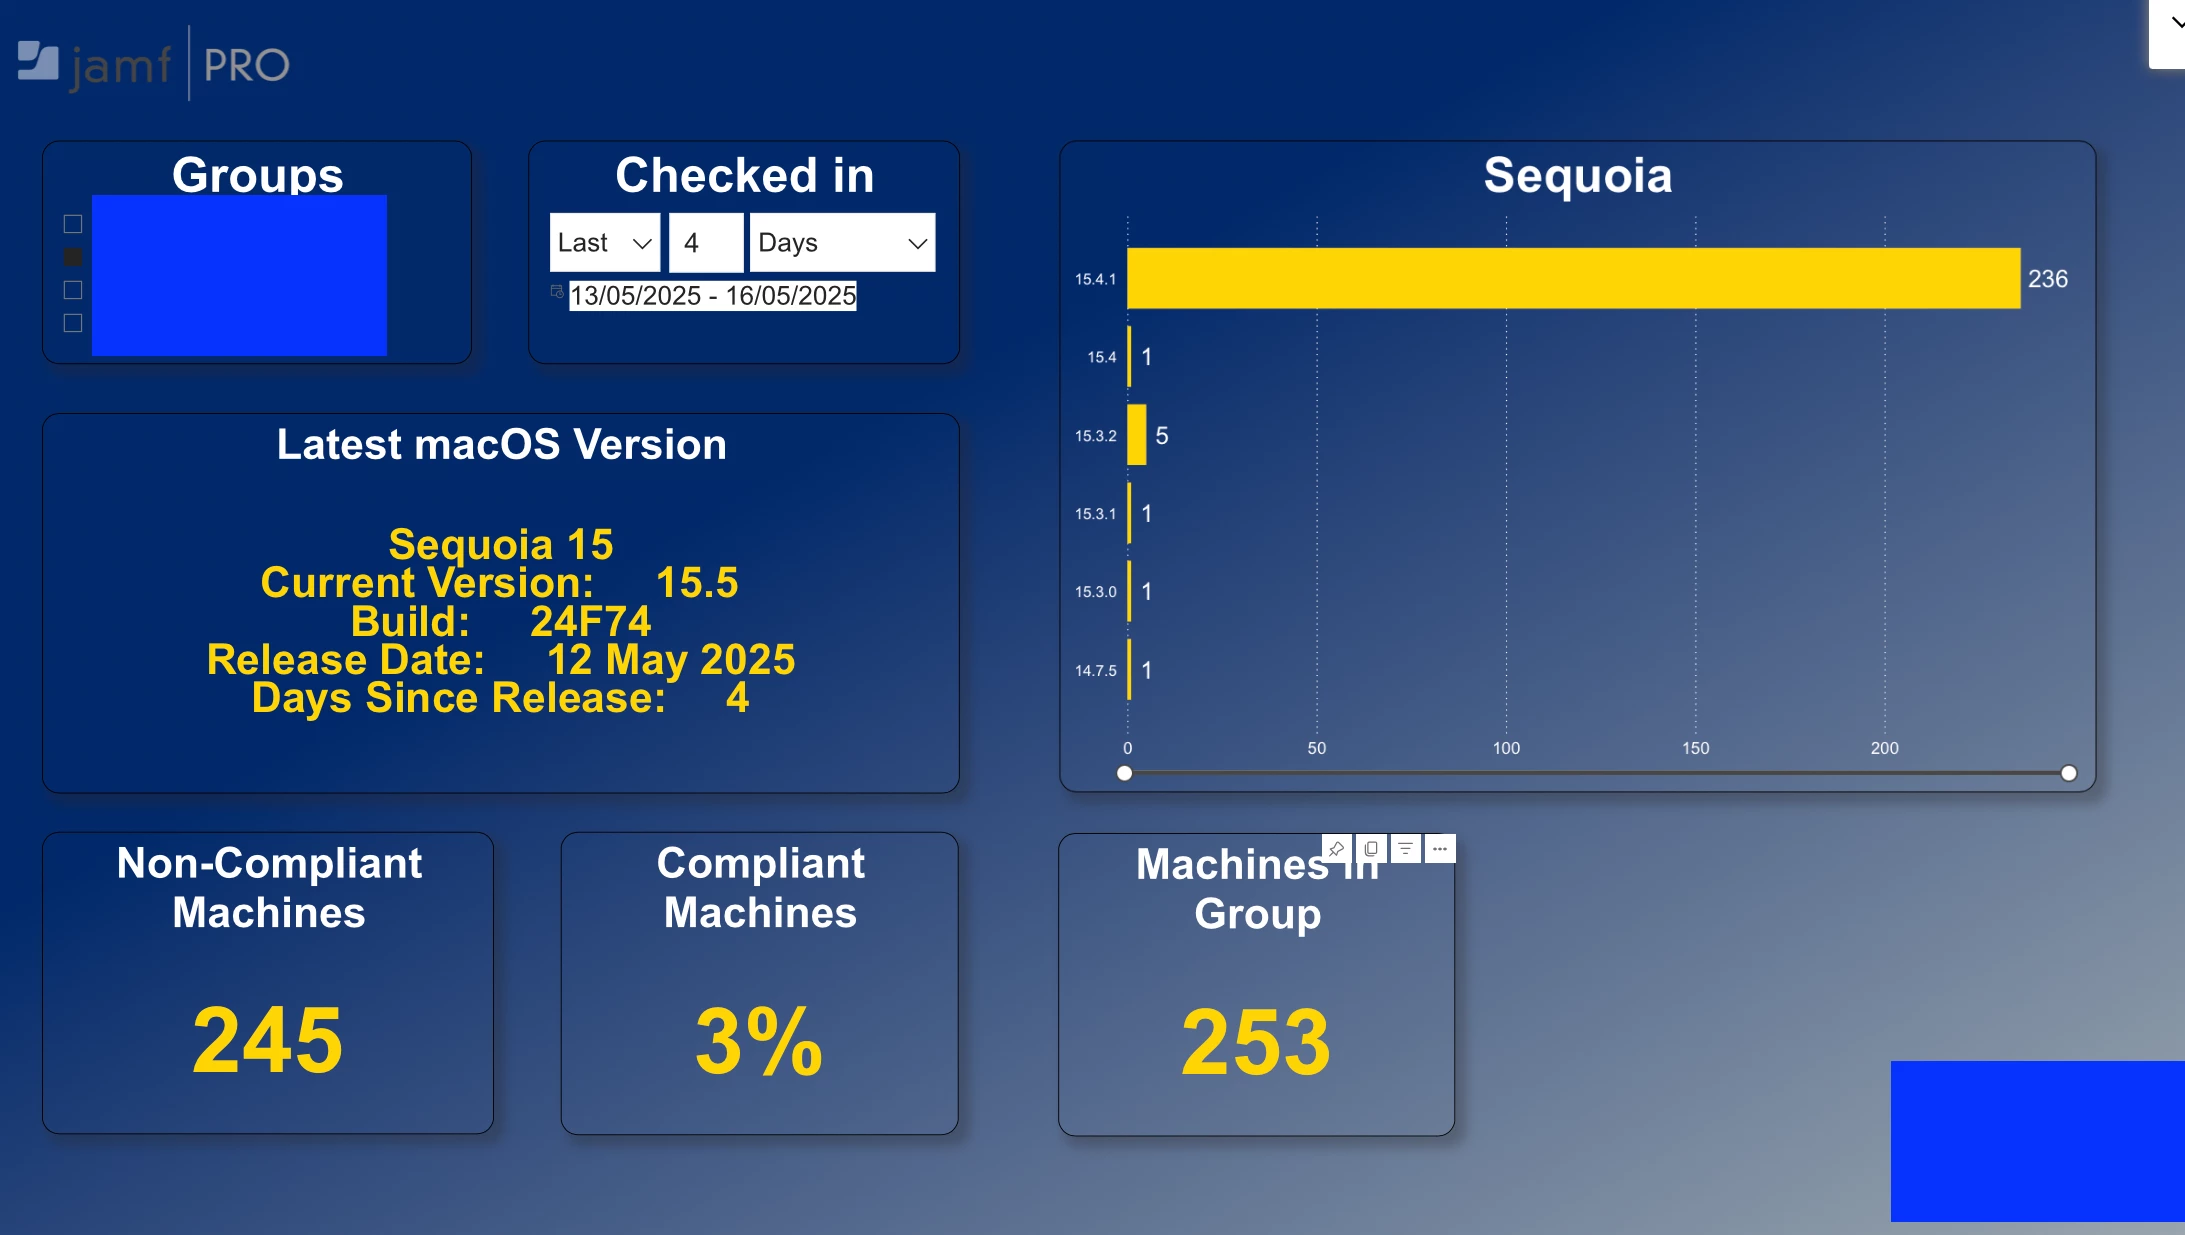
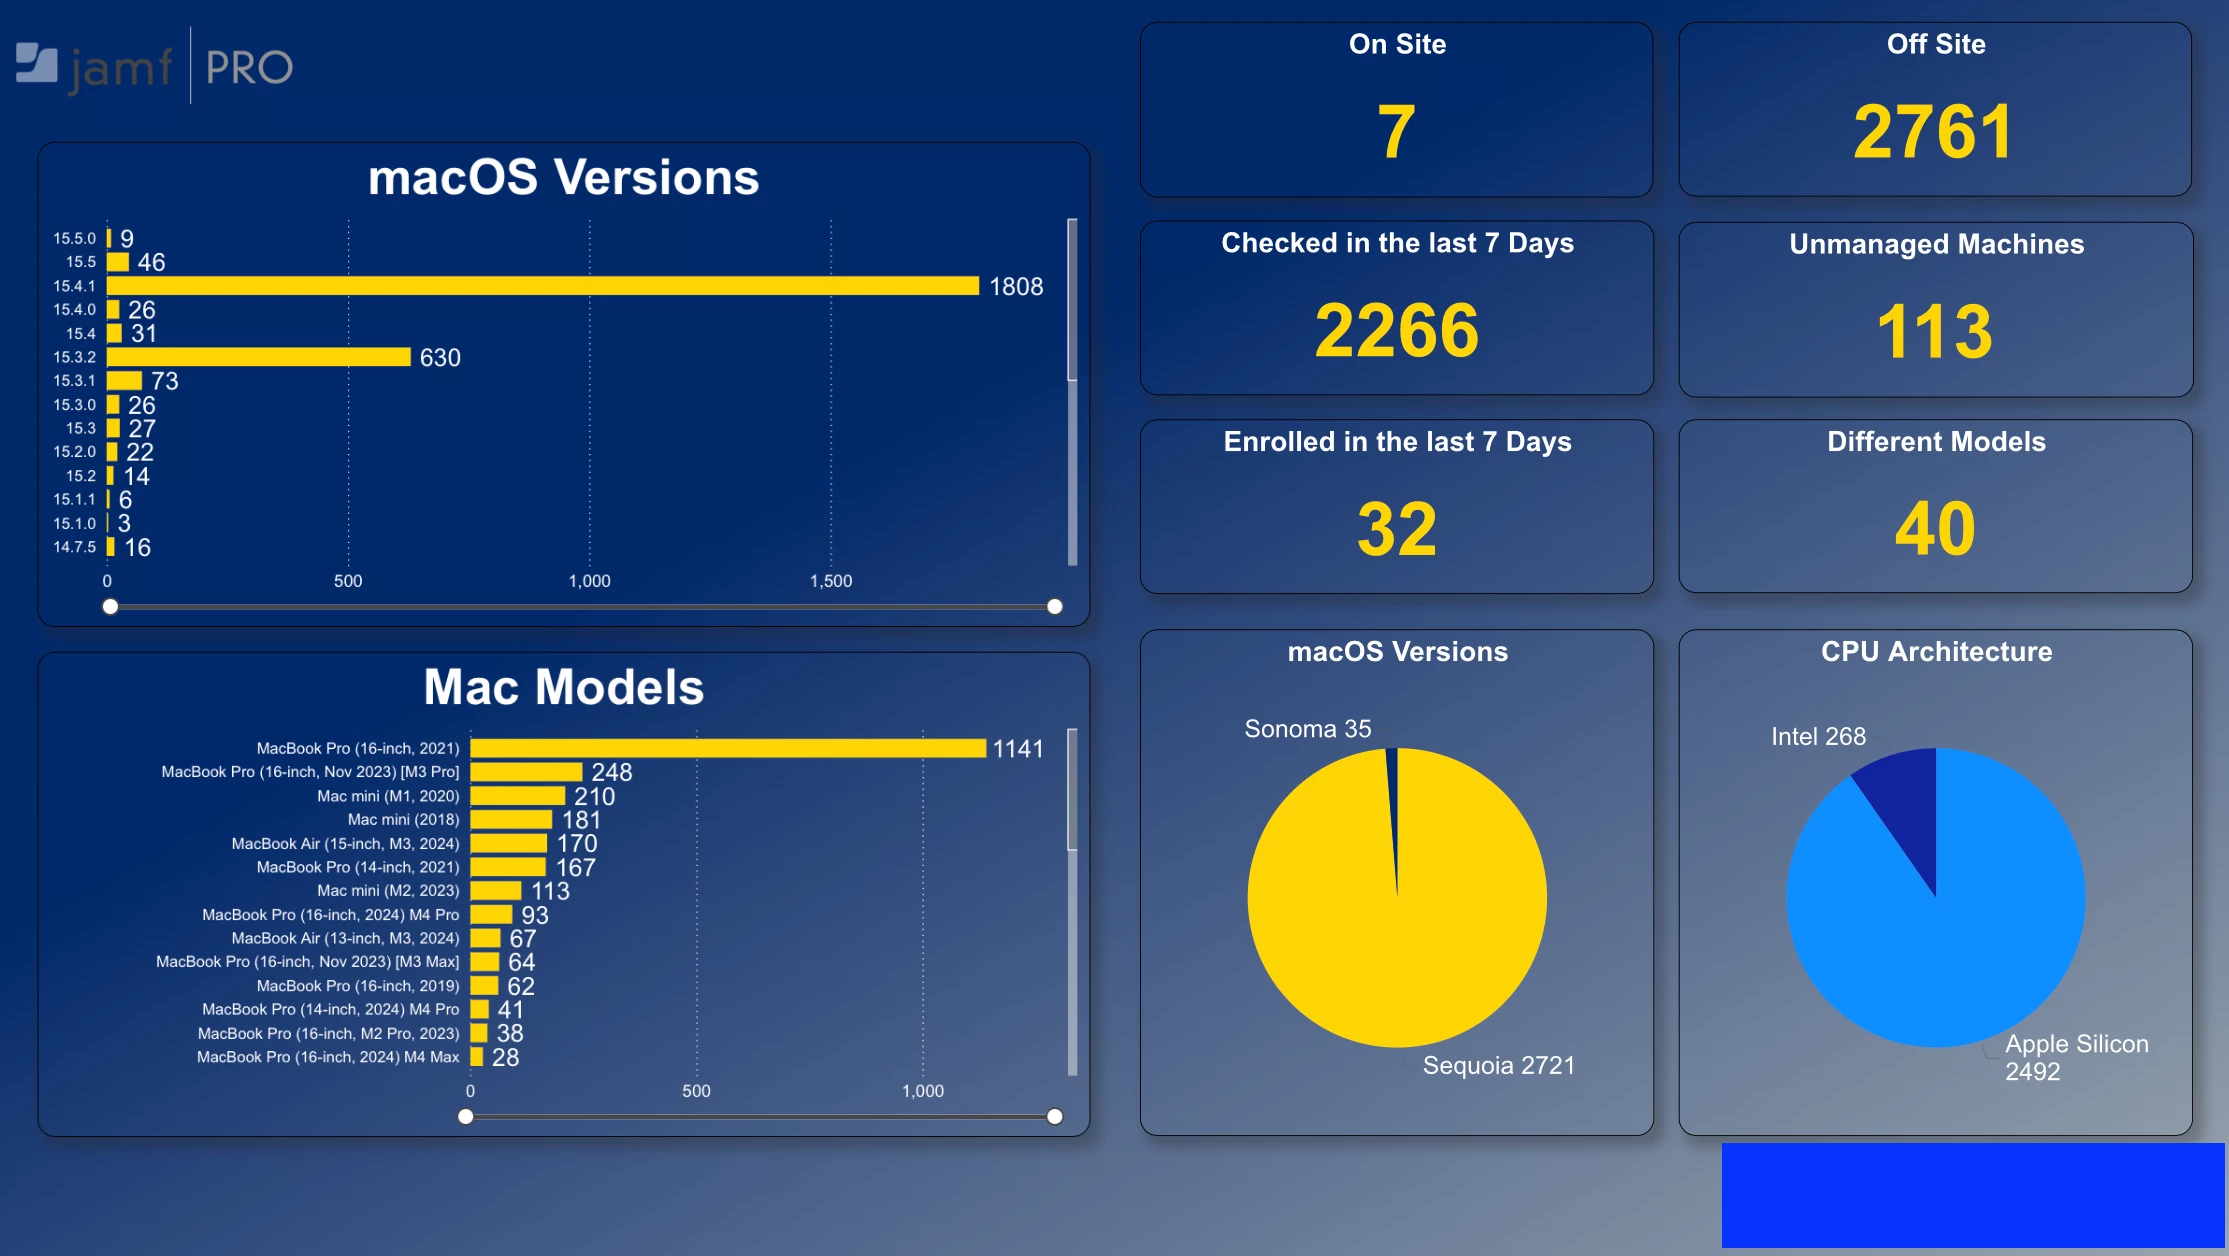
Here is a couple of pages from my PowerBI dashboard. One page is automatically updated using the SOFA json feed.


Reply