Macs running out of memory since Sonoma 14.1.2

ITnonameguy
New Contributor

Hi,

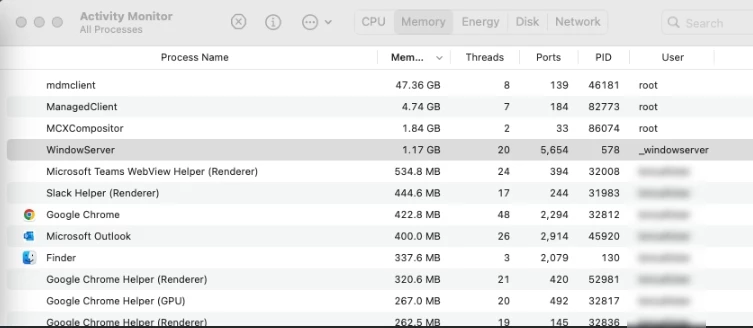
I spoke with Apple and they believe this is a Jamf issue. In my IT team, we have received since yesterday at least 5-10 users complaining that their memory is consistently being used up within approximately 20 minutes of restarting. This is something that they have to keep doing throughout the day to use the computer before it warns again to start closing apps due to low Application Memory. Even without anything open, the memory pressure starts to get up into the yellow.

There are a few processes we're seeing in Activity Monitor that spike into the GBs of memory used: 

ManagedClient, mdmclient, and MCXCompositor (this last one fluctuates though between a "normal" amount to then about 7GB for about 10 minutes, then back down).

Has anyone else seen this recently? 

1 ACCEPTED SOLUTION

edamelio
New Contributor III

We had the same issue and ended up helping make this a "known issue." You will have to work with JAMF support to fix your backend. This exact issue is what caused me to spend a few days with them to get to the bottom of it (ish). 
 
Computer configuration profiles with a Security and Privacy payload may unexpectedly lose the configured settings, causing blank or null values in the os_x_configuration_profiles database table. As a result, Jamf Pro endlessly sends new configuration profiles with unique identifiers to the computers in scope. Workaround: Remove target computers from the scope. Contact Jamf Support and reference PI115634.

View solution in original post

7 REPLIES 7

ITnonameguy
New Contributor

Here's a screenshot of one user's activity monitor for example:

Clipboard01.jpg


pete_c
Contributor III

What does jamf.log show when the mdmclient process has this usage?

What happens if you run jamf manage on an affected device?

Are you using Jamf's Patch Management or Mac Apps?

The jamf manage is normal. I just did it on one of the machines that was experiencing the memory spike. (I can't seem to upload an image while replying).

For jamf.log, all it shows around the time is this:

Wed Dec 13 12:28:35 <Username Replaced> jamf[4450]: Checking for policies triggered by "recurring check-in" for user "<Username Replaced>"...
Wed Dec 13 12:28:41 <Username Replaced> jamf[4450]: Checking for patches...
Wed Dec 13 12:28:41 <Username Replaced> jamf[4450]: No patch policies were found.
Wed Dec 13 12:37:29 <Username Replaced> jamf[4946]: Checking for policies triggered by "recurring check-in" for user "<Username Replaced>"...
Wed Dec 13 12:37:32 <Username Replaced> jamf[4946]: Checking for patches...
Wed Dec 13 12:37:32 <Username Replaced> jamf[4946]: No patch policies were found.
Wed Dec 13 12:45:43 <Username Replaced> jamf[5433]: Checking for policies triggered by "recurring check-in" for user "<Username Replaced>"...
Wed Dec 13 12:45:48 <Username Replaced> jamf[5433]: Checking for patches...
Wed Dec 13 12:45:48 <Username Replaced> jamf[5433]: No patch policies were found.
Wed Dec 13 12:54:32 <Username Replaced> jamf[5963]: Checking for policies triggered by "recurring check-in" for user "<Username Replaced>"...


Oh, and we do use Patch Management and Mac Apps.

edamelio
New Contributor III

We had the same issue and ended up helping make this a "known issue." You will have to work with JAMF support to fix your backend. This exact issue is what caused me to spend a few days with them to get to the bottom of it (ish). 
 
Computer configuration profiles with a Security and Privacy payload may unexpectedly lose the configured settings, causing blank or null values in the os_x_configuration_profiles database table. As a result, Jamf Pro endlessly sends new configuration profiles with unique identifiers to the computers in scope. Workaround: Remove target computers from the scope. Contact Jamf Support and reference PI115634.

YES! We discovered this last night, each computer has hundreds to thousands of profiles now installed, just showing as "General" with different unique identifiers under profiles. We removed the scope, and everyone said it resolved it. I have an open ticket, and I'll add that reference to it. Thanks!

edamelio
New Contributor III

For anyone wondering if they have this issue (based on my personal experience - not JAMF Support) or want to adapt to your own purposes: 

mdmclient Memory Usage:

#!/bin/bash
result=$(sudo top -o MEM -l 1  | awk '/mdmclient/ {print $8}')
echo "<result>$result</result>"

ManagedClient Memory Usage: 

#!/bin/bash
result=$(sudo top -o MEM -l 1  | awk '/ManagedClient/ {print $8}')
echo "<result>$result</result>"

MDM Installed Configuration Profiles from the client perspective as opposed to JAMF: 

#!/bin/sh
results=$(/usr/libexec/mdmclient QueryInstalledProfiles | grep PayloadUUID | wc -l)
/bin/echo "<result>$results</result>"


not gonna lie though - this incident has taught me way more than I want to know about Apple MDM but it has been an overall net positive even if this has taken me down many dead end rabbit holes.