
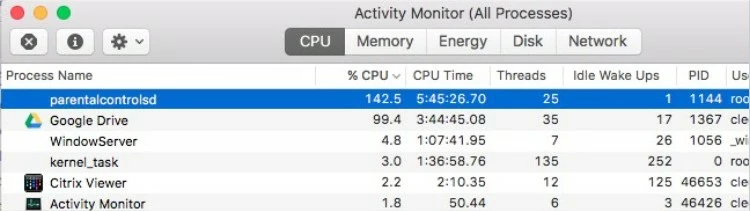
Hello all, I have ~150 Macs all bound through our AD, and also configured using Profile Manager. I don’t have anything out of the ordinary configured (Software Update, Munki URL, Screen Saver/Screen Lock) through profile manager, but I have several users with the parentalcontrolsd process either spiking their CPUs constantly, or in a couple cases, using ~6 GB RAM.

Anyone seen this issue or hopefully have a fix? Thanks so much in advance,

We actually have been experiencing this issue recently where a reboot would resolve this issue temporarily but then come up again after a few days.

What seems to fix this for us was to apply Energy Saver settings to not allow computers / hard drive to sleep.


not allow computers / hard drive to sleep

Thanks for the reply. Are you saying to not allow the computer and HDD to sleep?

Any idea what the root cause is? Feel like there are to few users for this to be a bug, maybe something we are doing wrong.


I've tested this with an out of the box Mac with just the OS (10.11.1) and a config profile with restriction payload settings applied and bound to AD. I noticed after waking the computer from sleep the memory usage would increase little by little each time and would also cause the CPU to spike and eventually become unusable after a few days.

I've also had 2 other test Macs running at the same time with the same config profile except with the Energy Saver settings listed above and they did not experience this issue. It took around 3-4 days to start seeing the issue occur.


I've been seeing this same problem for months but I have no explanation for it. The weird thing is it only seems to happen on a couple Macs, but it is always the parentalcontrolsd process. Users who report it say restarting their computer seems to make it stop... until the next time it happens. Unfortunately We need to set energy settings to let the computers sleep.


Someone mentioned on Slack that Apple have seen this & are working on a fix.

Please log bugs with Apple so they know it's affecting you.


@AVmcclint I think the reason you're only seeing this on a few devices may be because either the Macs are not constantly on or they're not reporting the issue. We originally thought it was only a few Macs experiencing this, but we're getting more and more reports of this issue occurring.


Posted this in another thread just now also, but our fix has been to turn off parental controls.

launchctl unload -w /System/Library/LaunchDaemons/com.apple.familycontrols.plist

Once we run that via policy it hasn't been reported again as an issue.


This is related to all instances of com.apple.applicationaccess.new.plist under /Library/Managed Preferences/. I've taken a look and all affected machines have parental controls explicitly disabled - if the setting is unenforced, parentalcontrolsd does not exhibit high cpu usage.

Guessing this is being distributed by Security & Privacy or Login Window (or Restrictions) payloads.

<?xml version="1.0" encoding="UTF-8"?>
<!DOCTYPE plist PUBLIC "-//Apple//DTD PLIST 1.0//EN" "http://www.apple.com/DTDs/PropertyList-1.0.dtd">
<plist version="1.0">
<dict>
    <key>PayloadUUID</key>
    <string>37D106F1-D4A2-42DA-AD2A-F186AC338537</string>
    <key>_manualProfile</key>
    <true/>
    <key>familyControlsEnabled</key>
    <false/>
</dict>
</plist>

I don't recommend this but it can be used as a temporary fix of sorts. https://gist.github.com/opragel/acf1e4661fac6d66745e9f781a89514e#file-tempfix_managedpref_parentalcontrolsd_cpu-sh


Any further information on this issue as one of our devs is seeing the same problem?


@nycnewman I've seen much better performance since upgrading to 10.11.6, can anyone else confirm?


My user is on 10.11.6 and still seeing issues. No longer with Parental Controls process but others. Only occurs when machine goes into Sleep mode.


@nycnewman What other processes are you seeing? What model hardware is the problem occurring on?


no longer parentalcontrolsd. now socketfilterfw, kernel_task (catch all), and accountsd

Mac Pro Mid 2015 15inch running 10.11.6

On support's request we enabled a policy that disabed parentcontrolsd


Wondering if anyone on this thread has an Apple Radar ID for reference on this behavior?


FWIW, saw this today.

I combined some payloads for the customer, as per this, & after a reboot things seem to be resolved.


Hi,
I'm seeing this too - even on Sierra. Would love a Radar ID or any tips people have found that does the trick

Thanks!
Matt


@mbezzo I followed bentoms article which did the trick.


@bentoms Hey Ben, we've tried that method as well and confirmed the issue still occurs after some time. It takes sometimes 2-3 weeks to build up and start spiking. A reboot will temporarily fix it until it starts building up again. It's difficult to test a solution for this since it takes time to see if it starts building up again. Some of our users restart their Macs regularly or do not have their Macs go to sleep often (this is when it seem to build up), so they don't notice this as much.


We are seeing this in our environment on machines running 10.12.2, restart is a temp mitigation but it builds back up after a few days.. anyone been able to resolve this?


Still an issue in 10.12.3! I really hope this can be fixed. It only seems to be effecting select computers at this point, it would be nice to know the cause of this.


Followed @bentoms article, found the items mentioned and created new profiles but issue is still present. Only select computers as well.


I checked with AppleCare Support today. The response was, known and test 10.12.4 beta to see if it's resolved.


I've tested with 5 machines that exhibit the parentalcontrolsd CPU churning issue under 10.12.4 beta and 3 of the four continued to exhibit the behavior. The other two are VM's and I'm going to let them run for a while. I suspect that after some period of time I'll see them ramp up CPU usage as well. I'm filing a bug report with Apple this morning against the beta.


Multiple users are reporting the issue in my environment. I've also been experiencing it on my 13" retina MBP. Hopefully 10.12.4 alleviates this issue.


@merps

How are you able to run that command when SIPs is enabled? Or, do you have it disabled in your environment?