Show off your reporting dashboard!

jamf_sam
Moderator
Moderator

Jamf Pro has built-in dashboards, but many admins want the flexibility of Business Intelligence (BI) or reporting tools. JNUC 2019 introduced integrations with some of the most popular tools. We have been hard at work creating resources to help you get the most out of your data, and now we want to see your dashboard!

If you have a great dashboard to share, please post it here! If you have tips or tricks that helped you build it, share it with your fellow admins. Remember to sanitize any sensitive data before posting.

Integrating Jamf with Splunk

63 REPLIES 63

cybertunnel
New Contributor II

@perryd84 are you referring to the Check-In, or looking for the actual number of devices? If the latter, than you might want to run a scheduled task that updates either a CSV or another storage method where Power BI could pull the data from.

perryd84
Contributor III

Thanks @cybertunnel I'm now pulling the info from the JAMF API to a csv which is stored in sharepoint which is attached to power BI. Working a treat! Thanks for the tip!!

Tangentism
Contributor III

Those who use Splunk for reporting, what is it that you gain that can't be accessed on the Jamf interface?

oliver
New Contributor III
New Contributor III

Tangentism, please see this doc and Lisa/Kevin's JNUC 2020 Splunk presentation for some examples. There are some example dashboards in the same repo as the pdf doc. If you scroll up in this thread there are some super slick d-boards from DBrowning and LisaCherie. But you might go at this from a different angle... think about what issues your device management program is being asked to address and how data and visualizations might be used to provide meaningful insights or active monitoring. Then go from there.

oliver
New Contributor III
New Contributor III

BurroHen
New Contributor II

For those using Splunk, are you using the free version (with the 500MB limit) or a paid tier? Thanks!

maiksanftenberg
Contributor II

I wonder if @DBrowning might be able to help.
I would be interested to know how to get the percentage for example for OS versions like 10.14 into my Dashboard?
I had been able to get the numbers out of a query but would like to understand how I can add the percentage.

DBrowning
Valued Contributor II

@maik.sanftenberg Here is the code that I'm using in one of my examples above.

<panel>
      <title>Clients on 10.15 (Catalina)</title>
      <single>
        <title>Total</title>
        <search>
          <done>
            <set token="tokCatalinaCount">$result.sum(count)$</set>
          </done>
          <query>index=cai_app sourcetype=JamfModularInput computer.Computer_Group.Computer_Group_Membership.Group="Macs on 10.15" | rare limit=20000 computer.name | stats sum(count)</query>
          <earliest>-60m@m</earliest>
          <latest>now</latest>
          <sampleRatio>1</sampleRatio>
          <refresh>60m</refresh>
          <refreshType>delay</refreshType>
        </search>
        <option name="colorMode">block</option>
        <option name="drilldown">none</option>
        <option name="height">178</option>
        <option name="rangeColors">["0x006d9c","0x006d9c","0x006d9c","0x006d9c","0x53a051"]</option>
        <option name="rangeValues">[0,750,1500,2250]</option>
        <option name="refresh.display">progressbar</option>
        <option name="underLabel">Clients on 10.15 Catalina</option>
        <option name="useColors">1</option>
        <option name="useThousandSeparators">0</option>
      </single>
      <single>
        <title>Percentage</title>
        <search>
          <query>| makeresults | eval Total=$tokTotalCount$, Catalina=$tokCatalinaCount$ | eval percent=round((Catalina/Total)*100,2) | table percent</query>
          <earliest>-60m@m</earliest>
          <latest>now</latest>
          <sampleRatio>1</sampleRatio>
          <refresh>60m</refresh>
          <refreshType>delay</refreshType>
        </search>
        <option name="colorMode">none</option>
        <option name="drilldown">none</option>
        <option name="height">171</option>
        <option name="numberPrecision">0.00</option>
        <option name="rangeColors">["0x006d9c","0x006d9c","0x006d9c","0x006d9c","0x53a051"]</option>
        <option name="rangeValues">[0,25,50,75]</option>
        <option name="refresh.display">progressbar</option>
        <option name="unit">%</option>
        <option name="useColors">1</option>
        <option name="useThousandSeparators">0</option>
      </single>
    </panel>

jphillips
Release Candidate Programs Tester

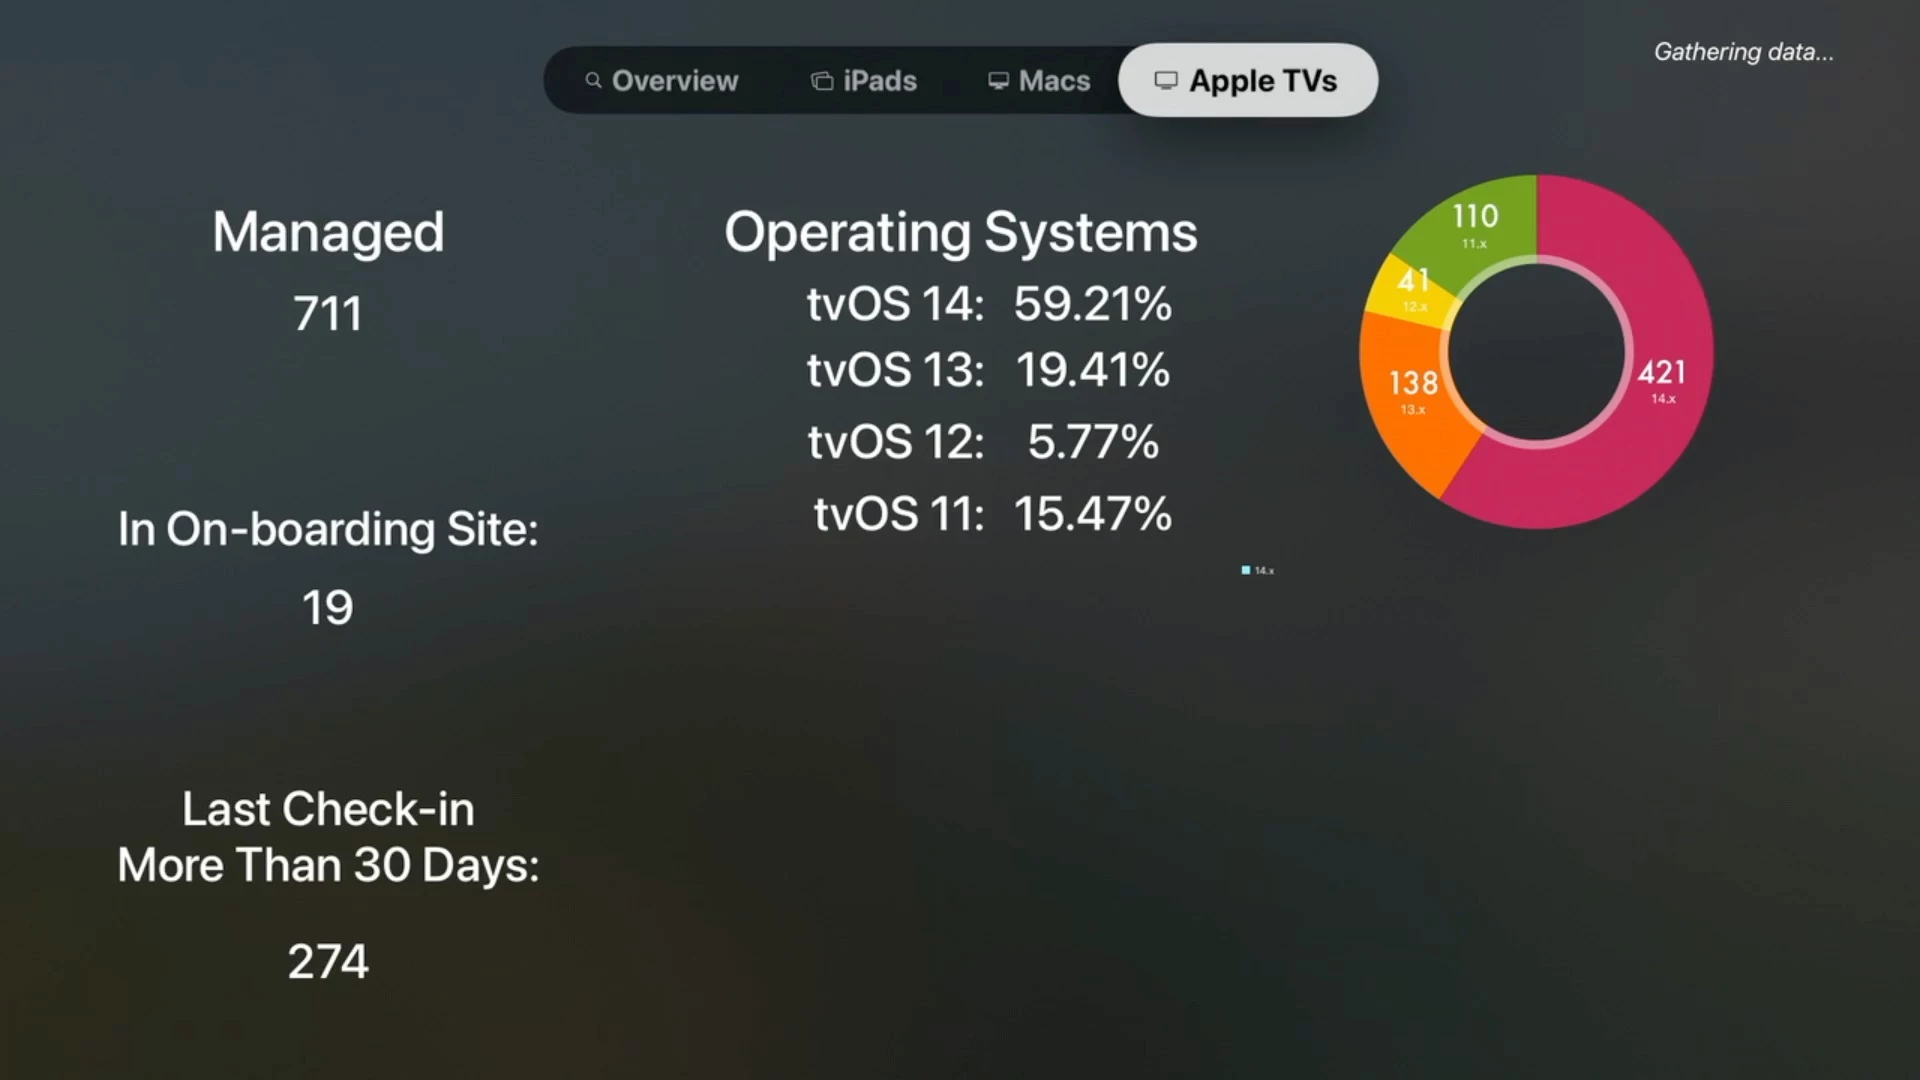
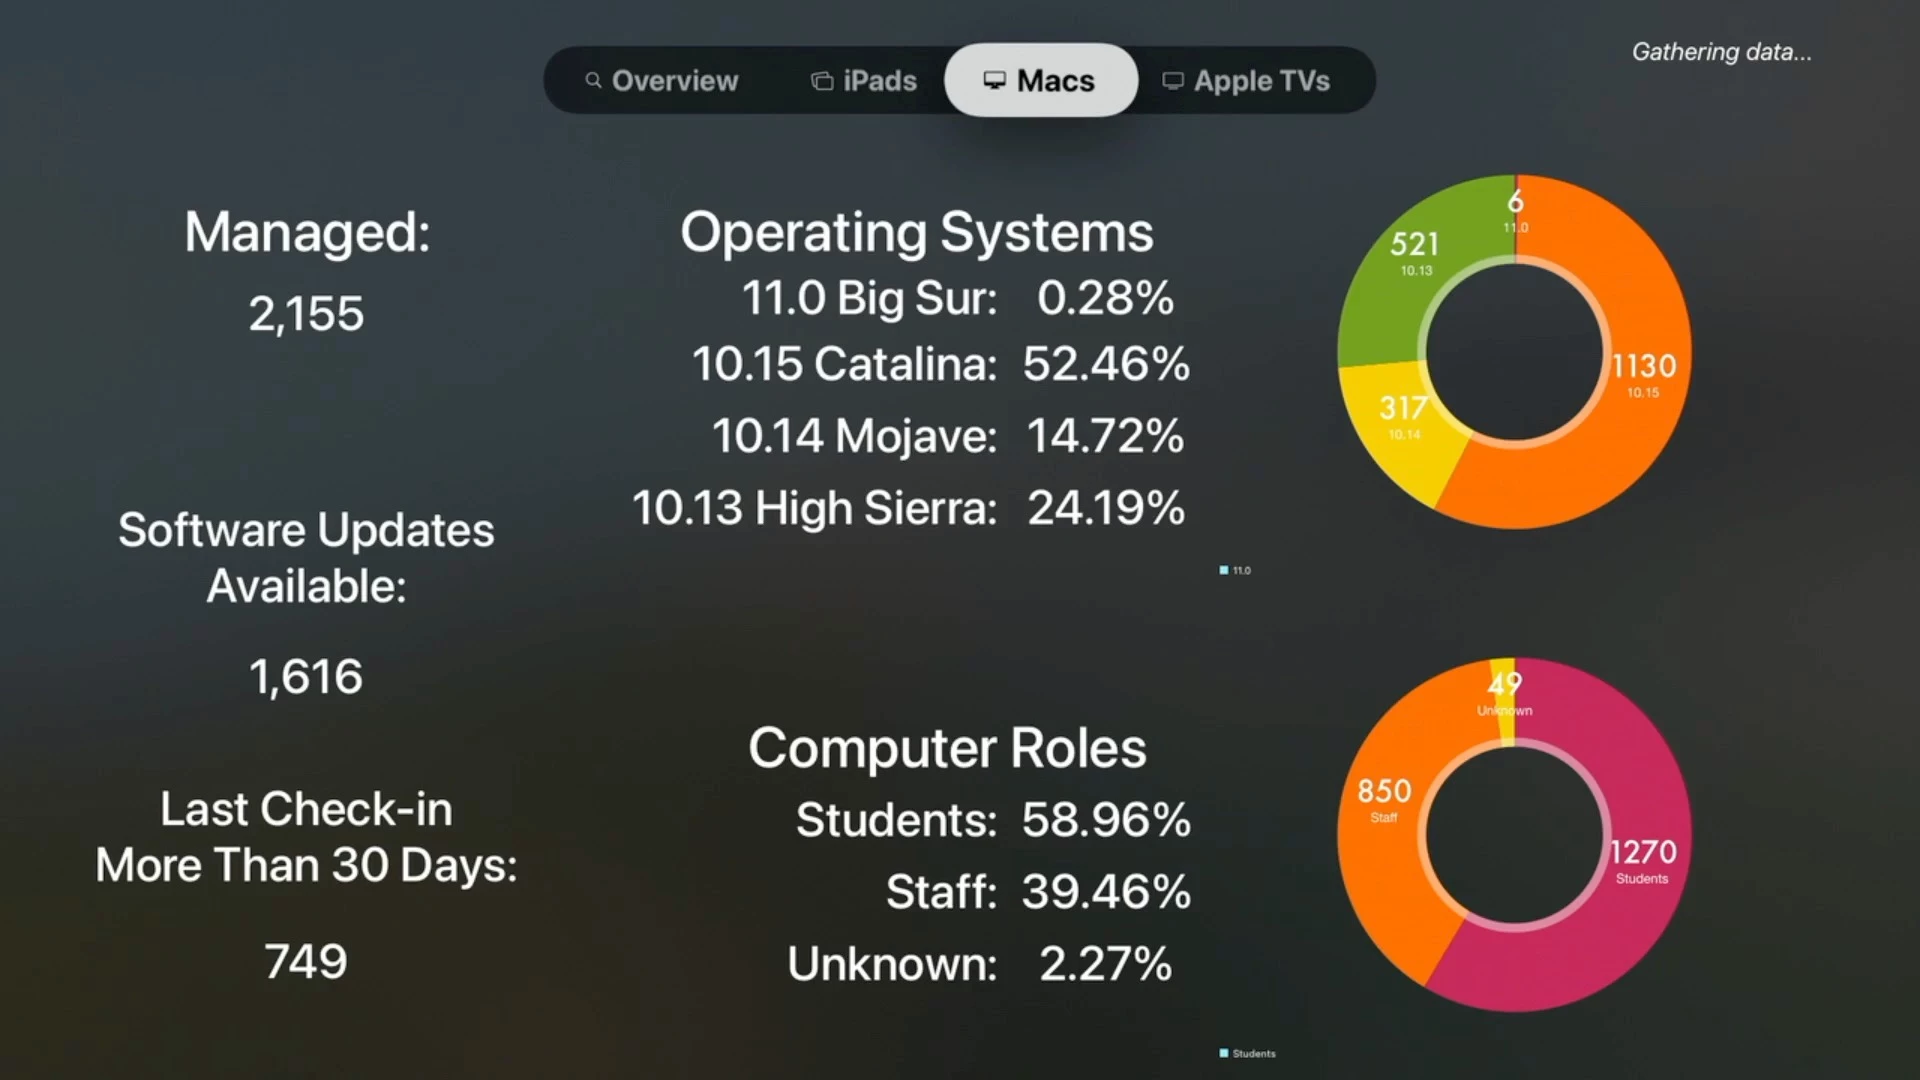
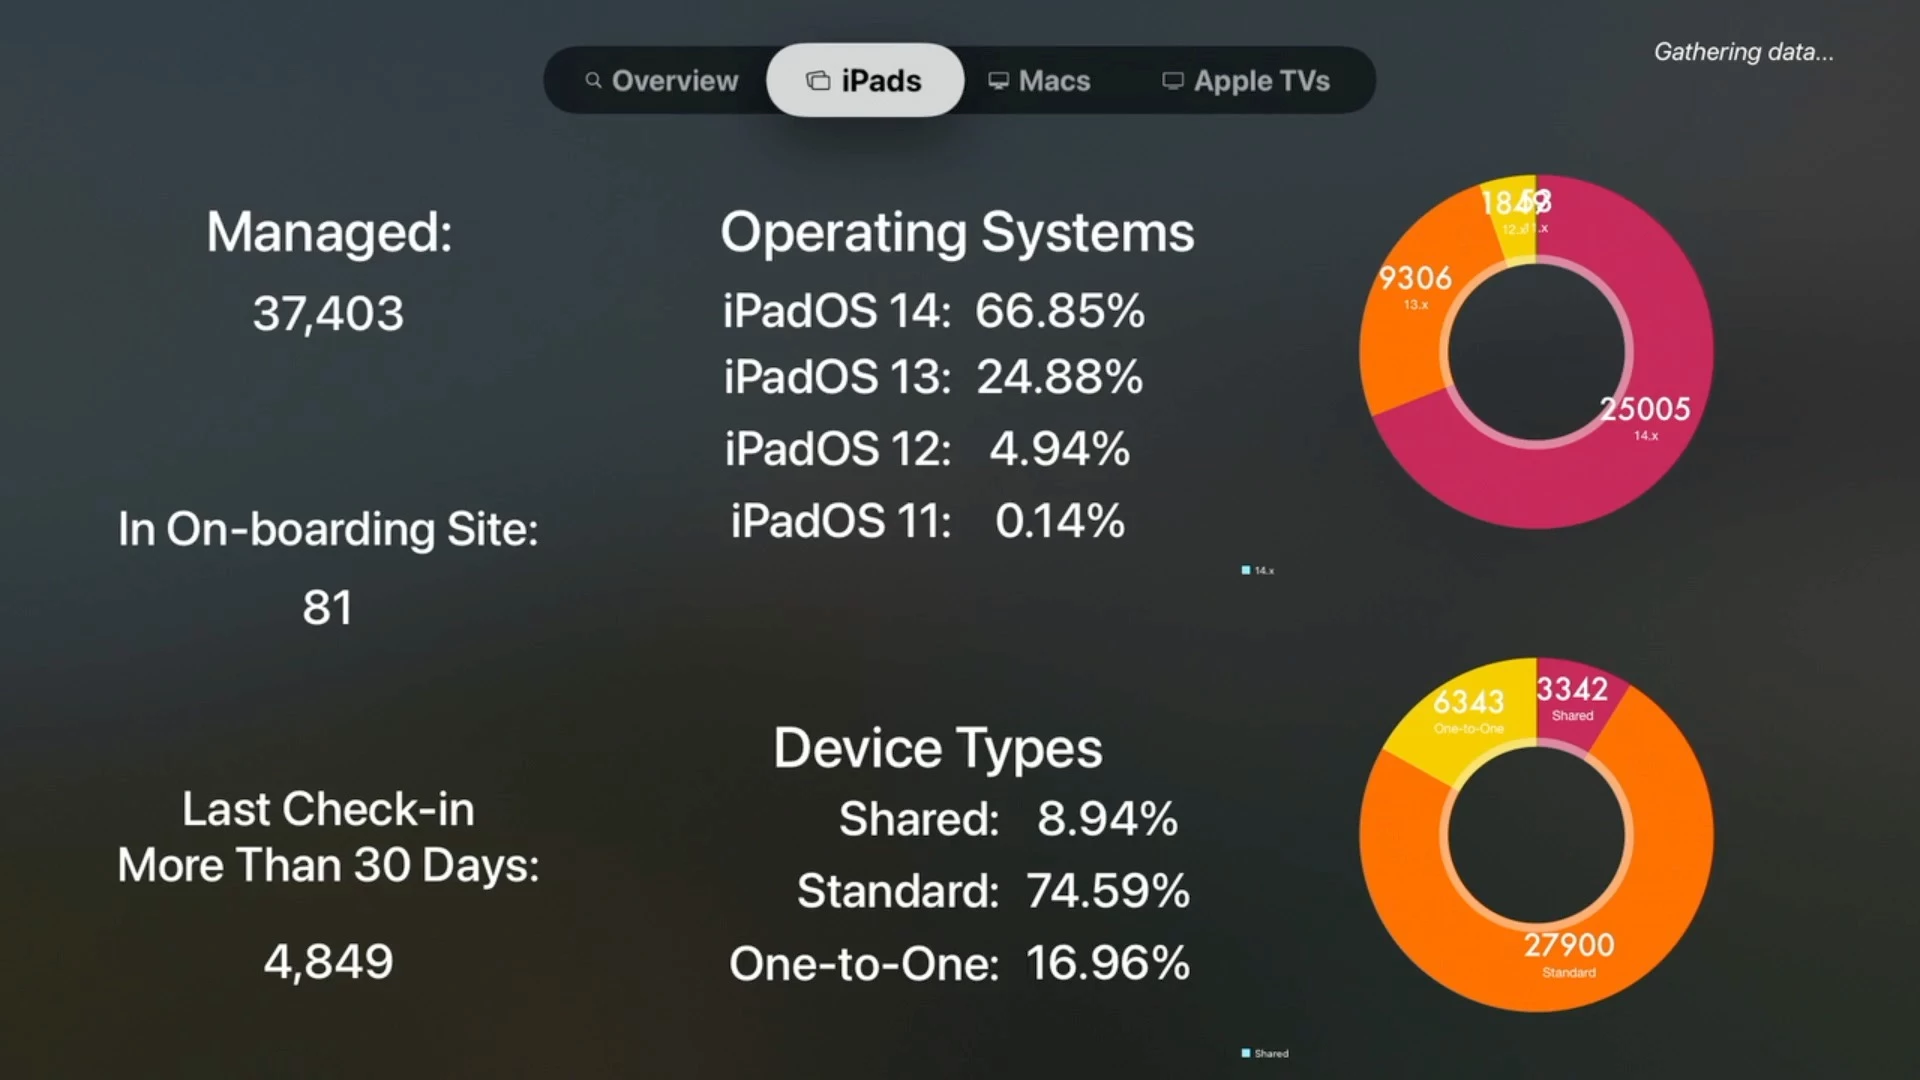
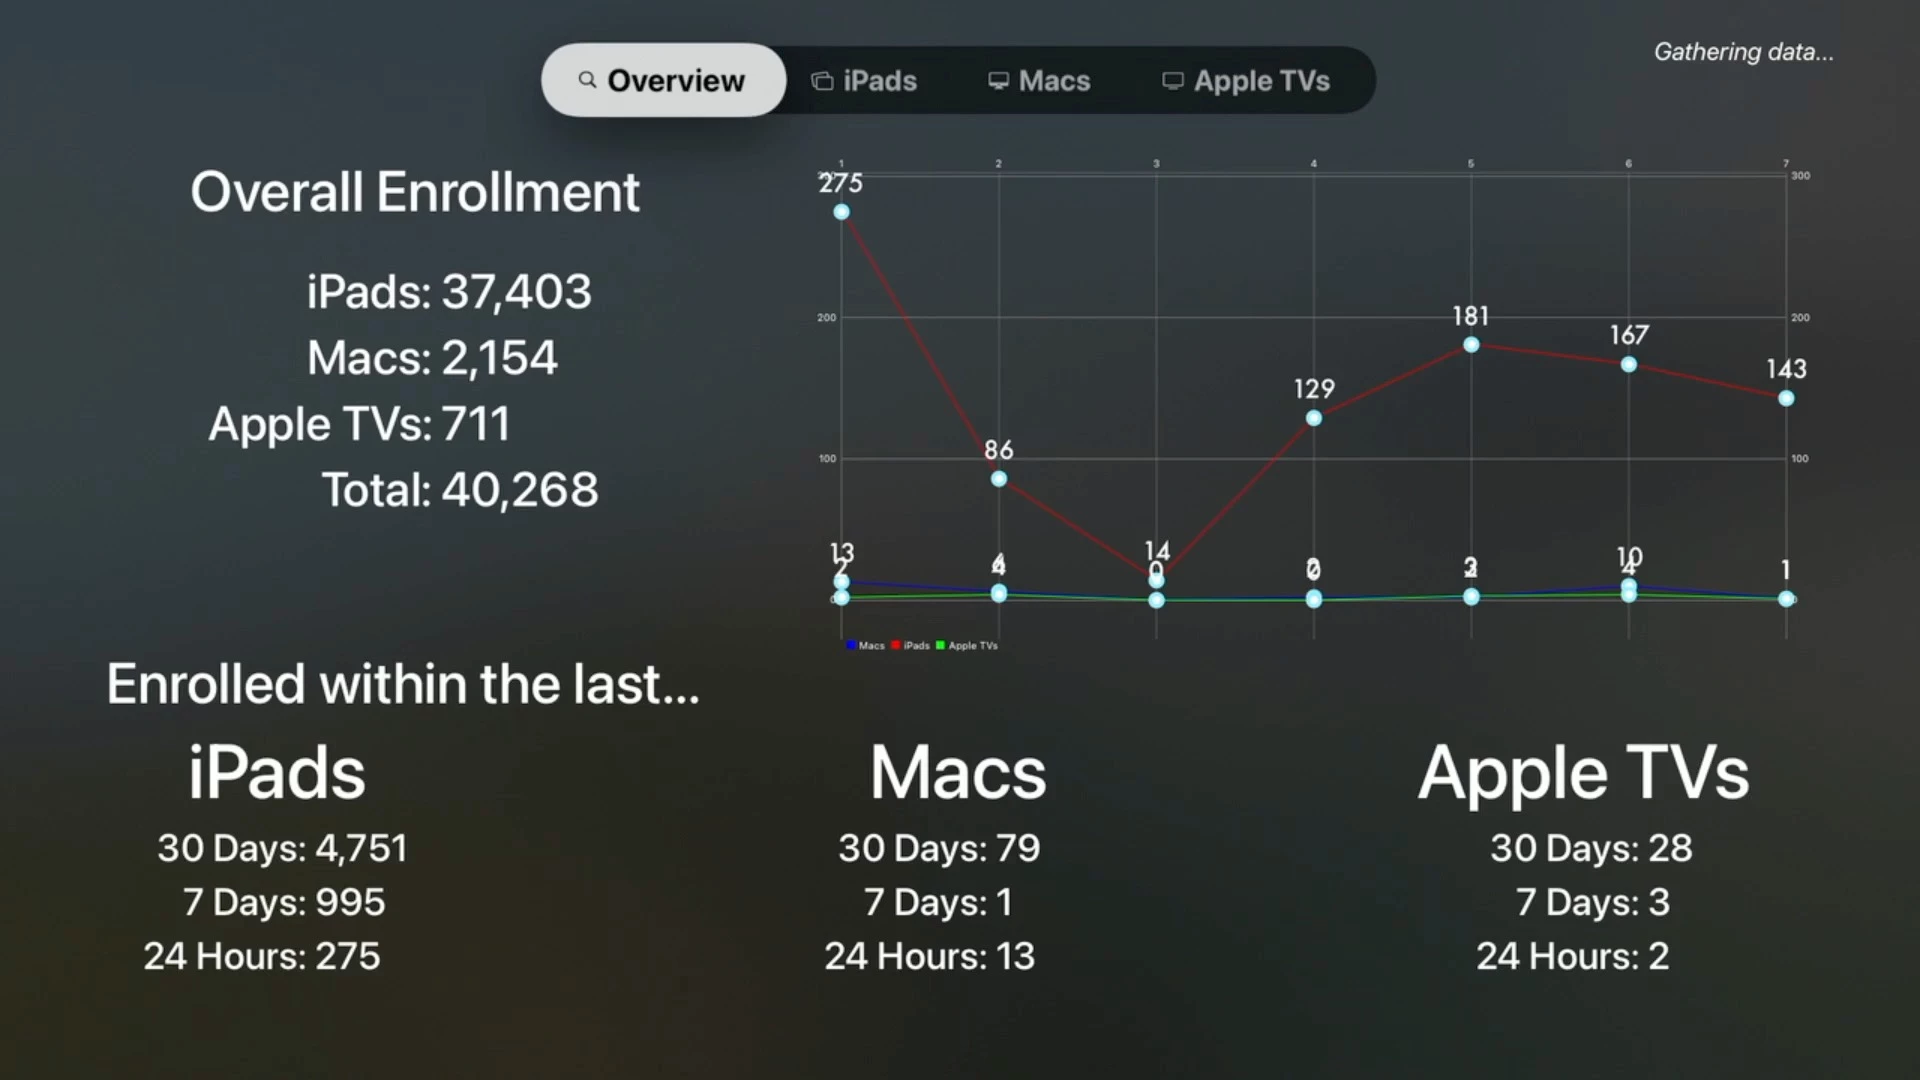
We looked into Spelunk but couldn't get the cost approved (being a school district), so I decided to make my own Apple TV app that does a more basic data pull
70b9791e70474dfaae40a469667ebb5a

a66753e395b245168d913050411e5f46

be71bebbe57a45c7b43871c17e4c2b28

f9d91cb6b9b84fffbcf3c0e5da33ad00

colorenz
Contributor II

@bejohnson Hi, can you share you Dashboard as a Template?

nnewport
New Contributor III

@jphillips do you have a copy of the app that we can use and modify for our needs? We too are a school district with limited budgets, but none of us really have any experience making Apple TV apps.

{/quote}

pete_c
Contributor III

Does anyone have any examples they could share showing changes over time? I've been asked to deliver reporting on traditional 'patch Tuesday' type uptake, ie how many users have run a patching script over a period of time, or how many devices are not on their current OS build. Thanks!

user-OypcHspeIk
New Contributor

We recently started to pull logs from Jamf Pro using API as per Slunk App add-on, but those logs are just one huge mess.

For example extension_attributes have arbitrary field names are not constant:

computer.extension_attribute.extension_attribute.extension_attribute.extension_attribute.multi_value

and

computer.extension_attributes.extension_attribute.extension_attribute.extension_attribute.extension_attribute.extension_attribute.extension_attribute.multi_value

Some fields names have over 20 repeated "extension_attribute". This applies to all the field names and they have varied length of repeated nested object names.

On top of this many of the entries are multivalue which means you have to mvzip and then expand them in order to do any meaningful stats on them.

Then there seem to be quite a few truncated entries that are missing end tags like:

Normal one:

<extension_attribute> <id>22</id> <name>Cososys Launch Daemon Loaded</name> <type>String</type> <multi_value>false</multi_value> <value>Yes</value> </extension_attribute>

Missing tags:

<extension_attribute> <id>126</id> <name>Installation Date </extension_attribute>

So my question is what are we doing incorrectly as I don't see many people mentioning these issues and they have dashboard panels showing data which is literally impossible with the current data we have in splunk coming through via API.

Any help would be much appreciated.

wdrain01
New Contributor II

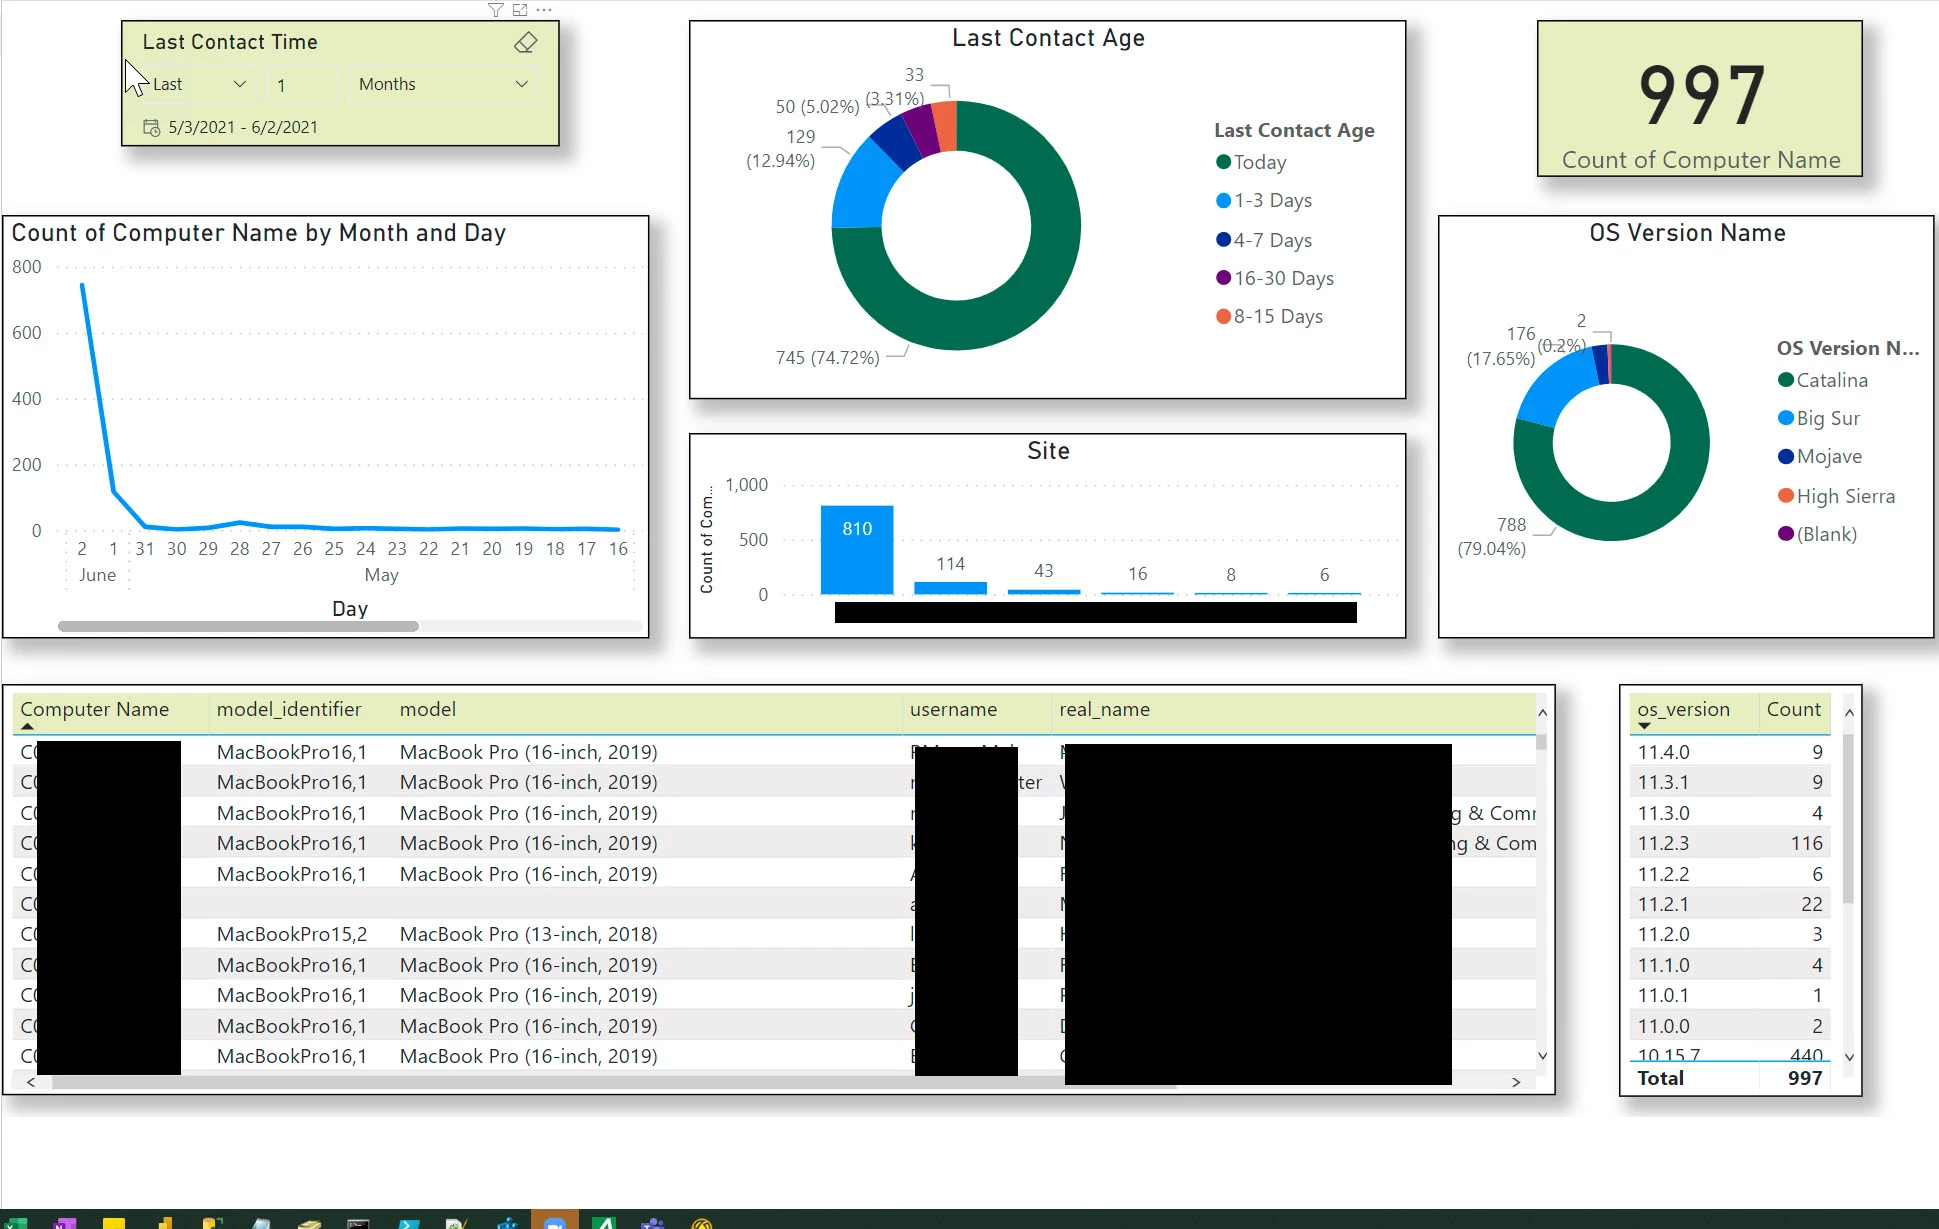
These are some great dashboard ideas shared. Here is one I have created and we are using using Power BI.

99663977fdea411894da0a4bc661b77d

colorenz
Contributor II

Can you Share it as Template? @wdrain01

technotica
New Contributor II

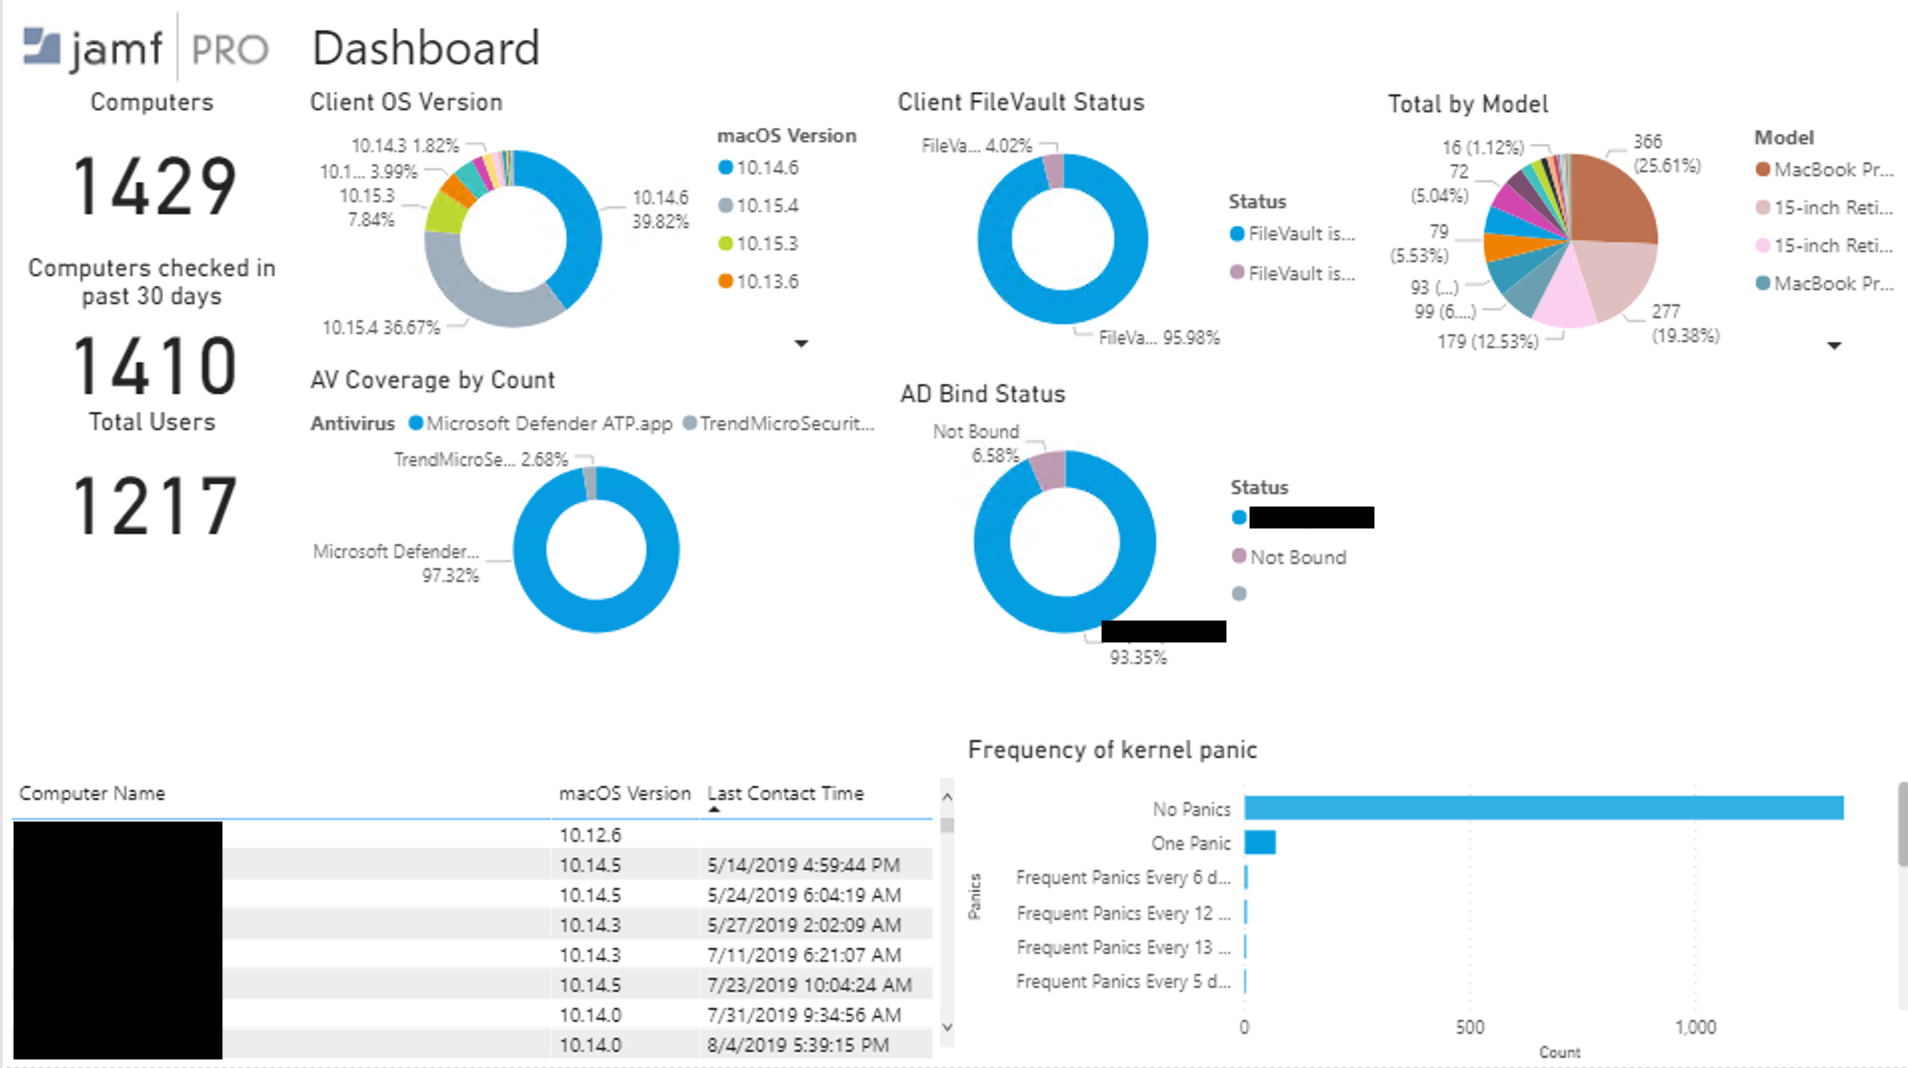
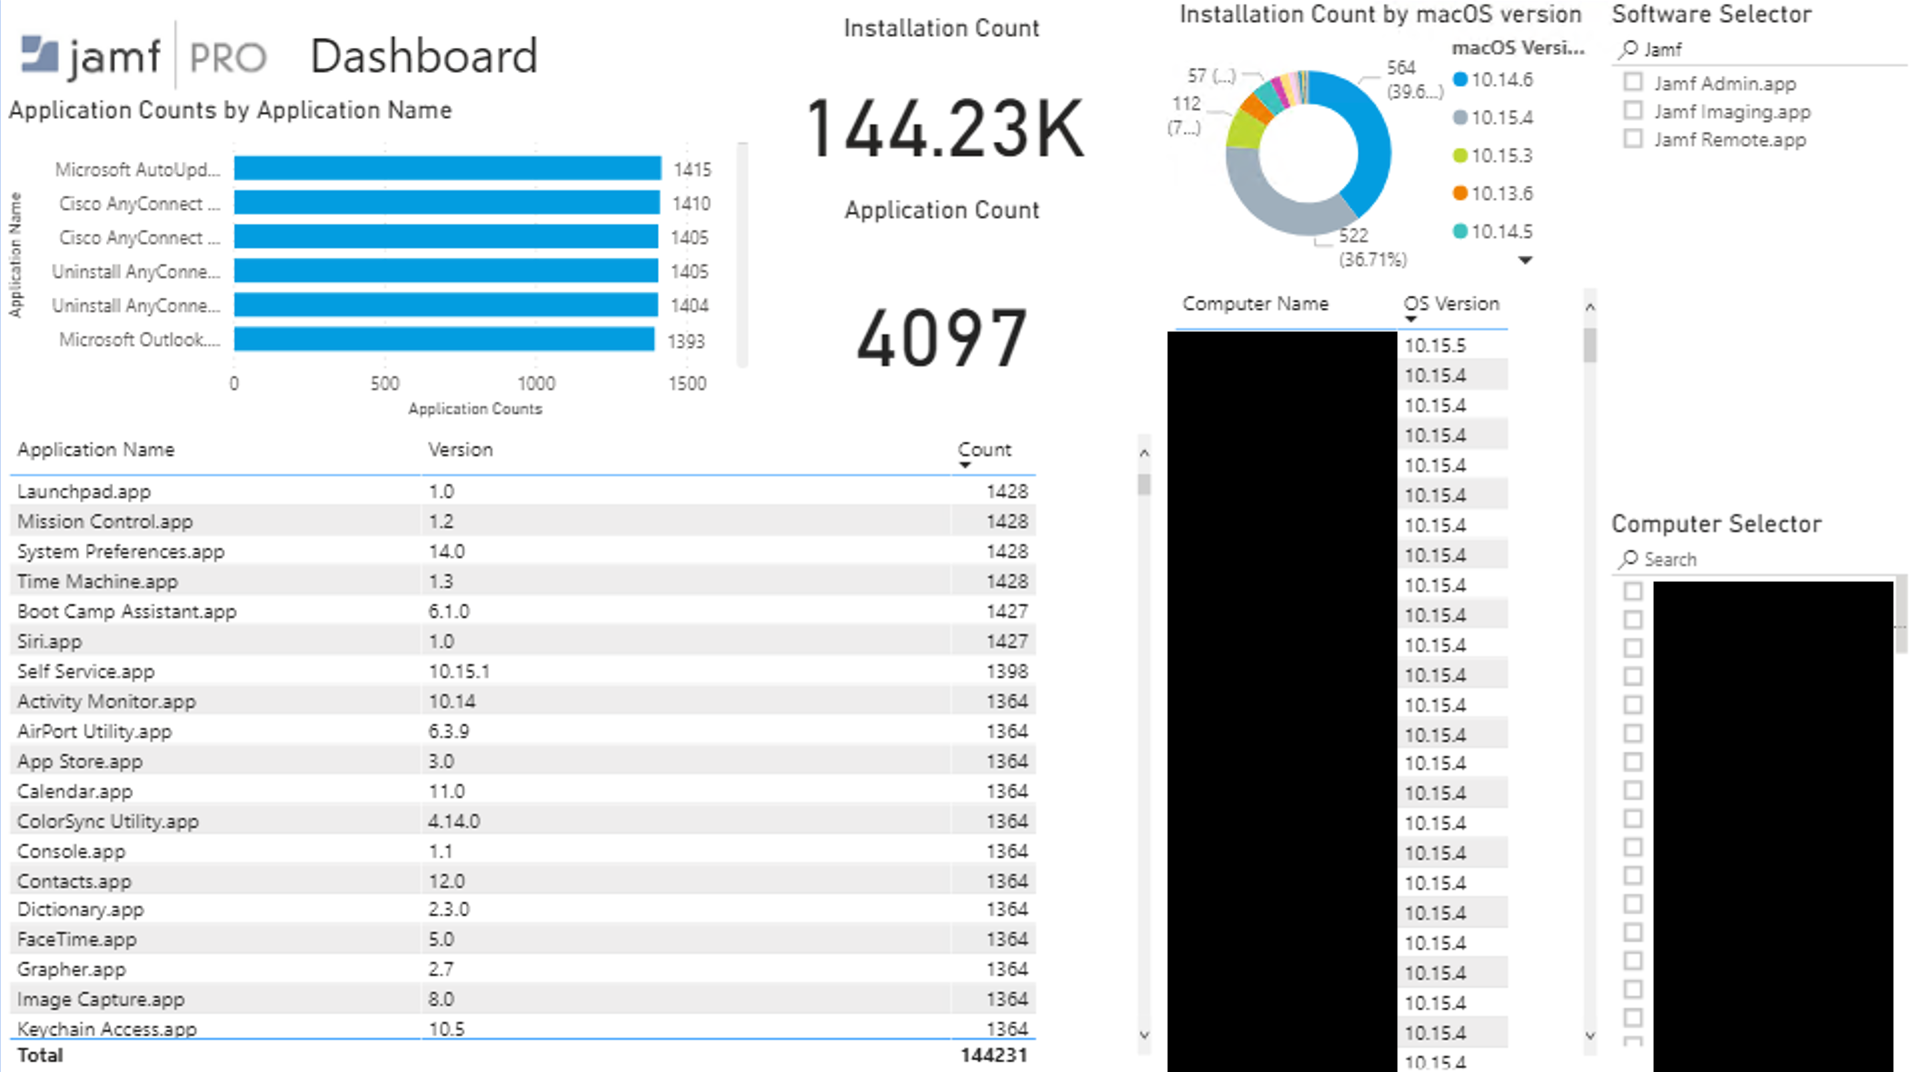
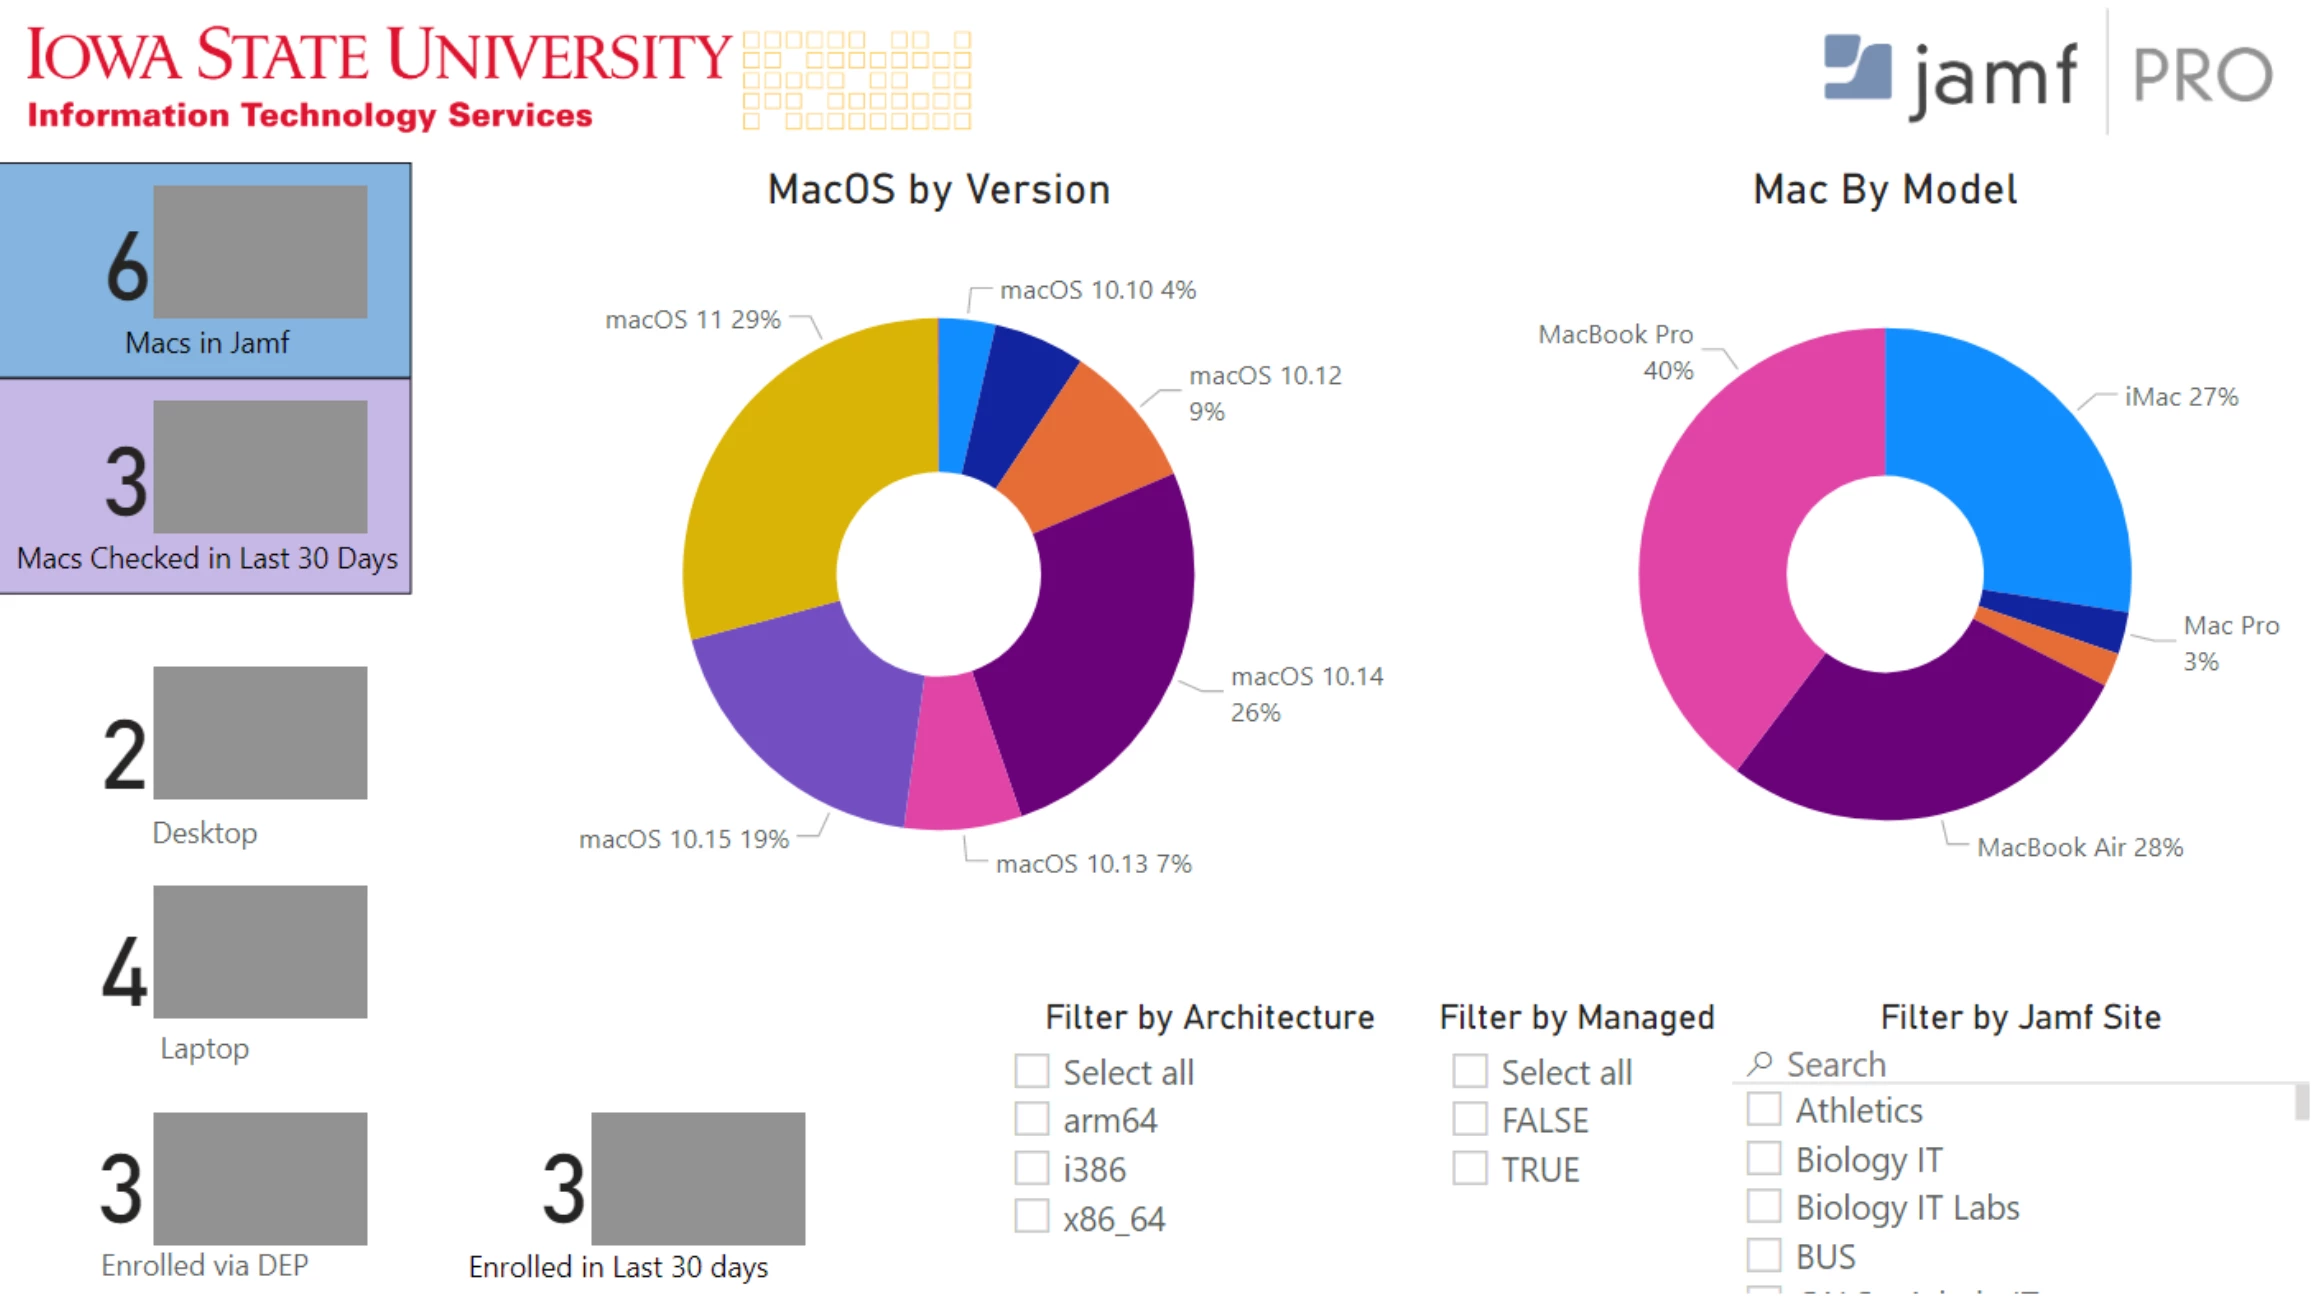
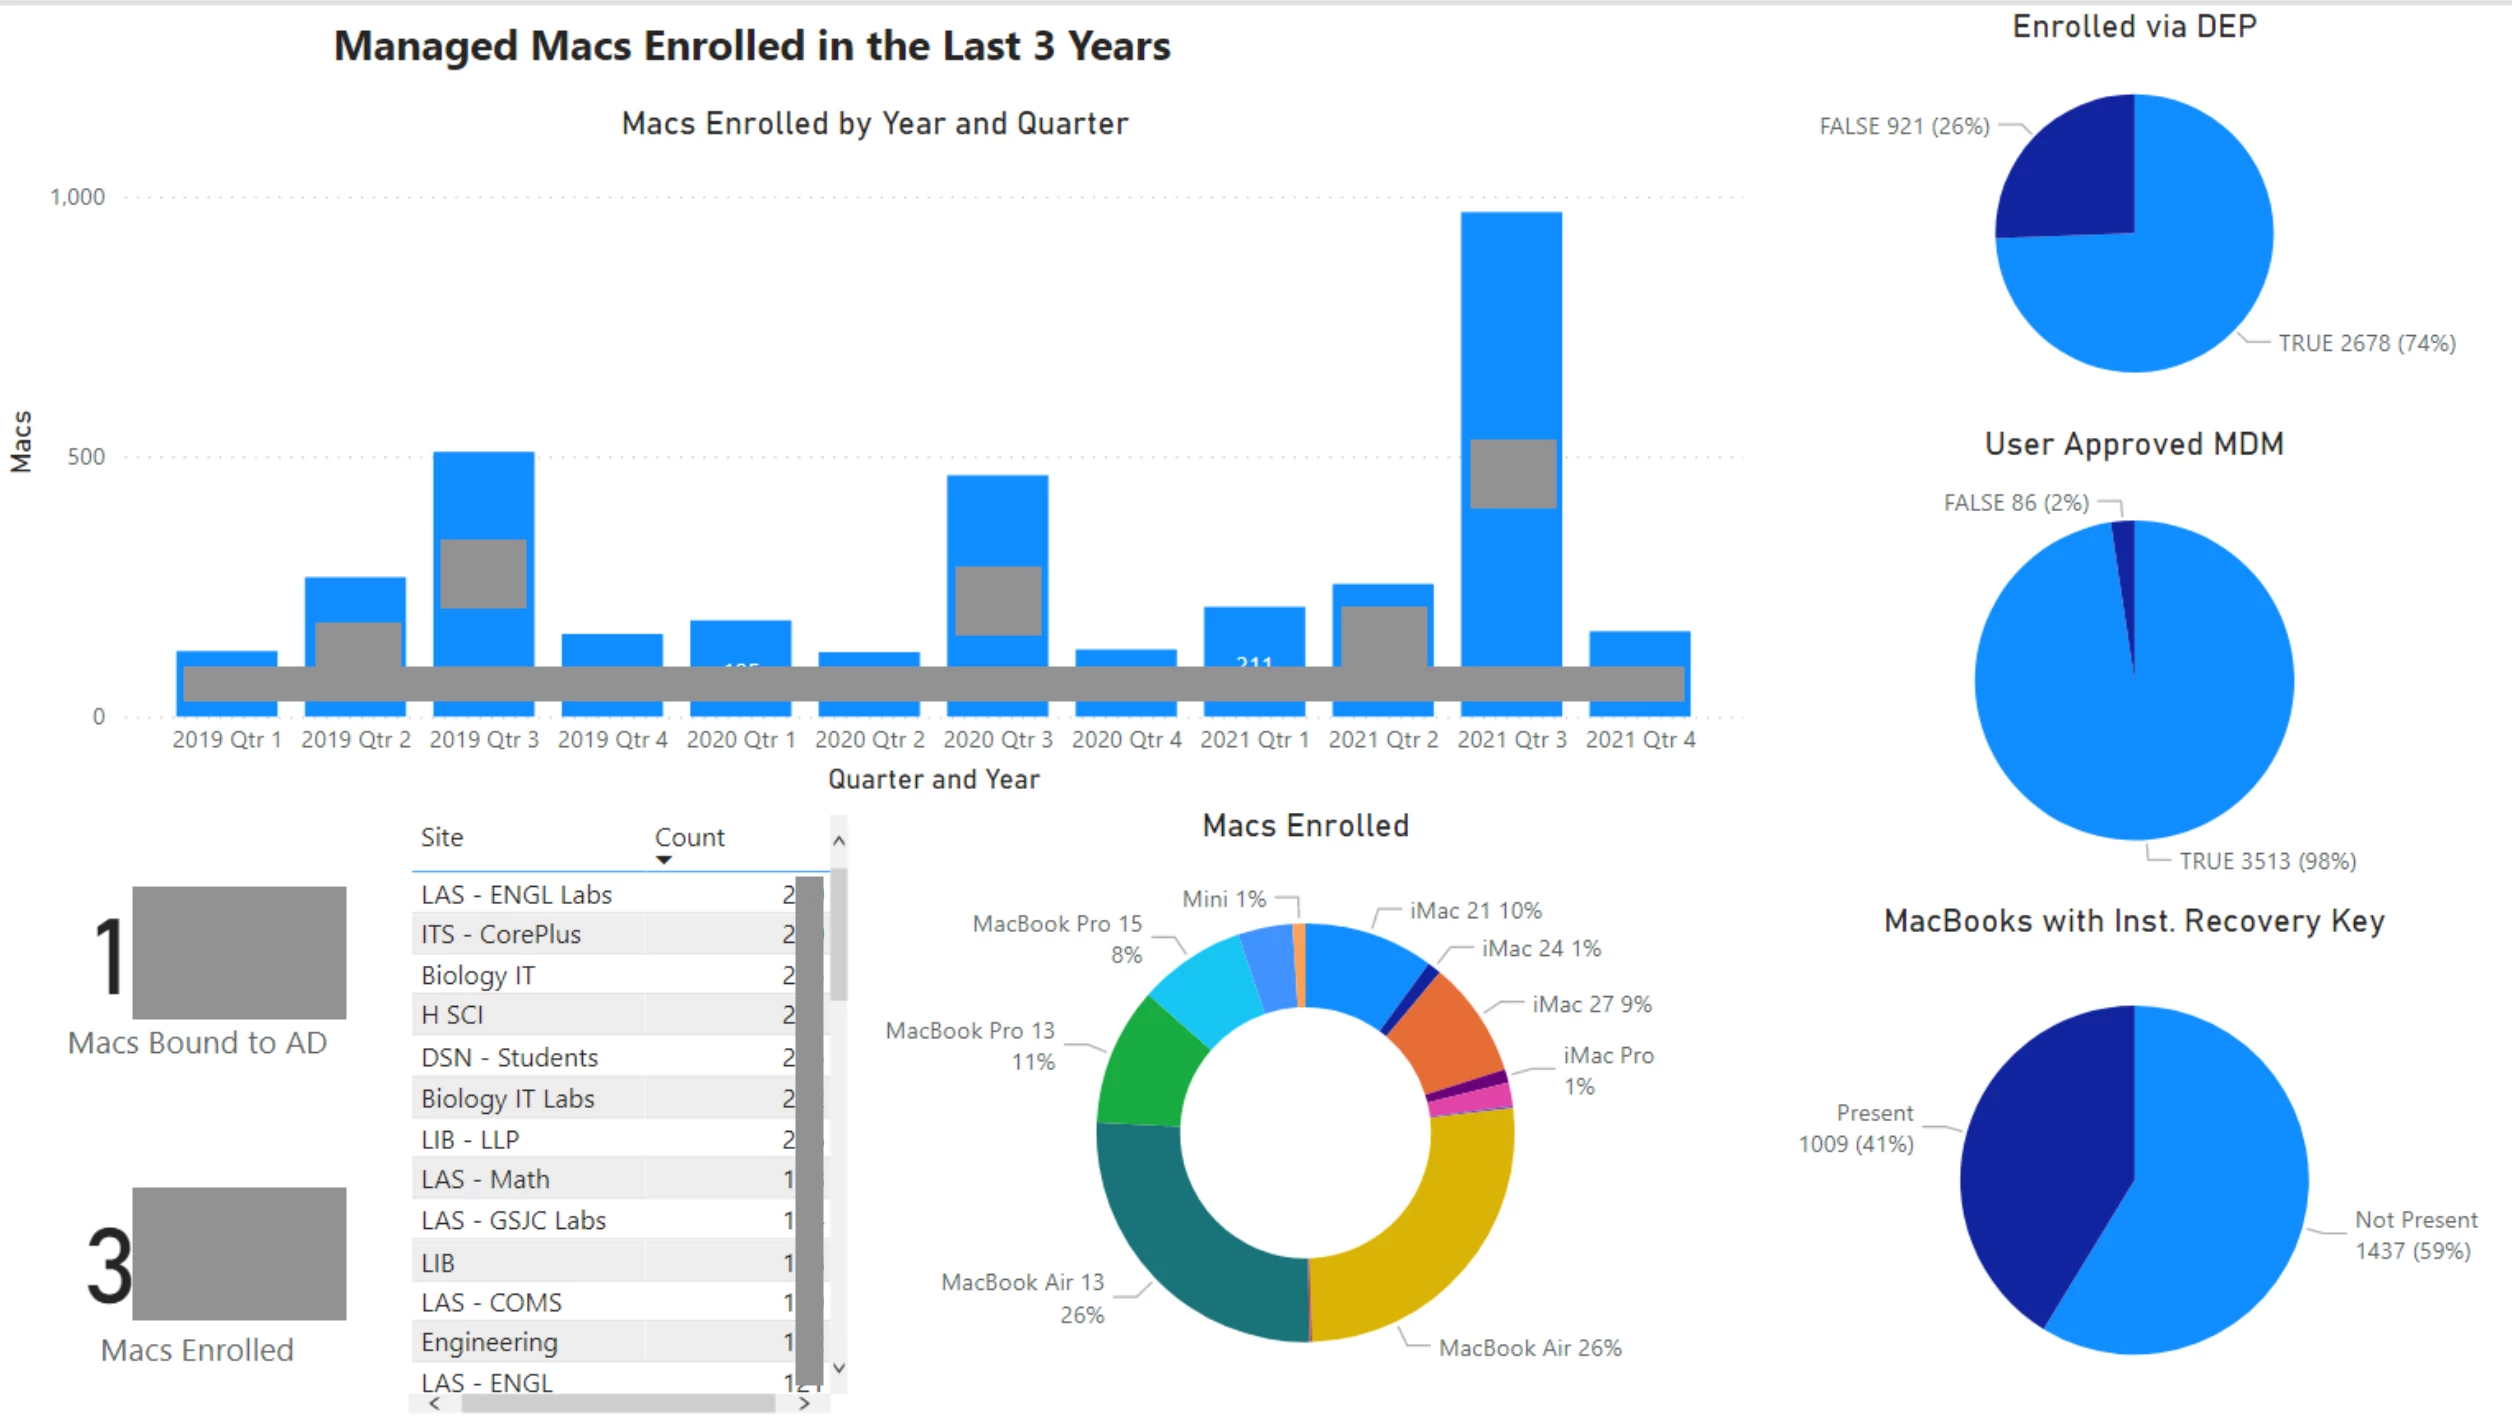
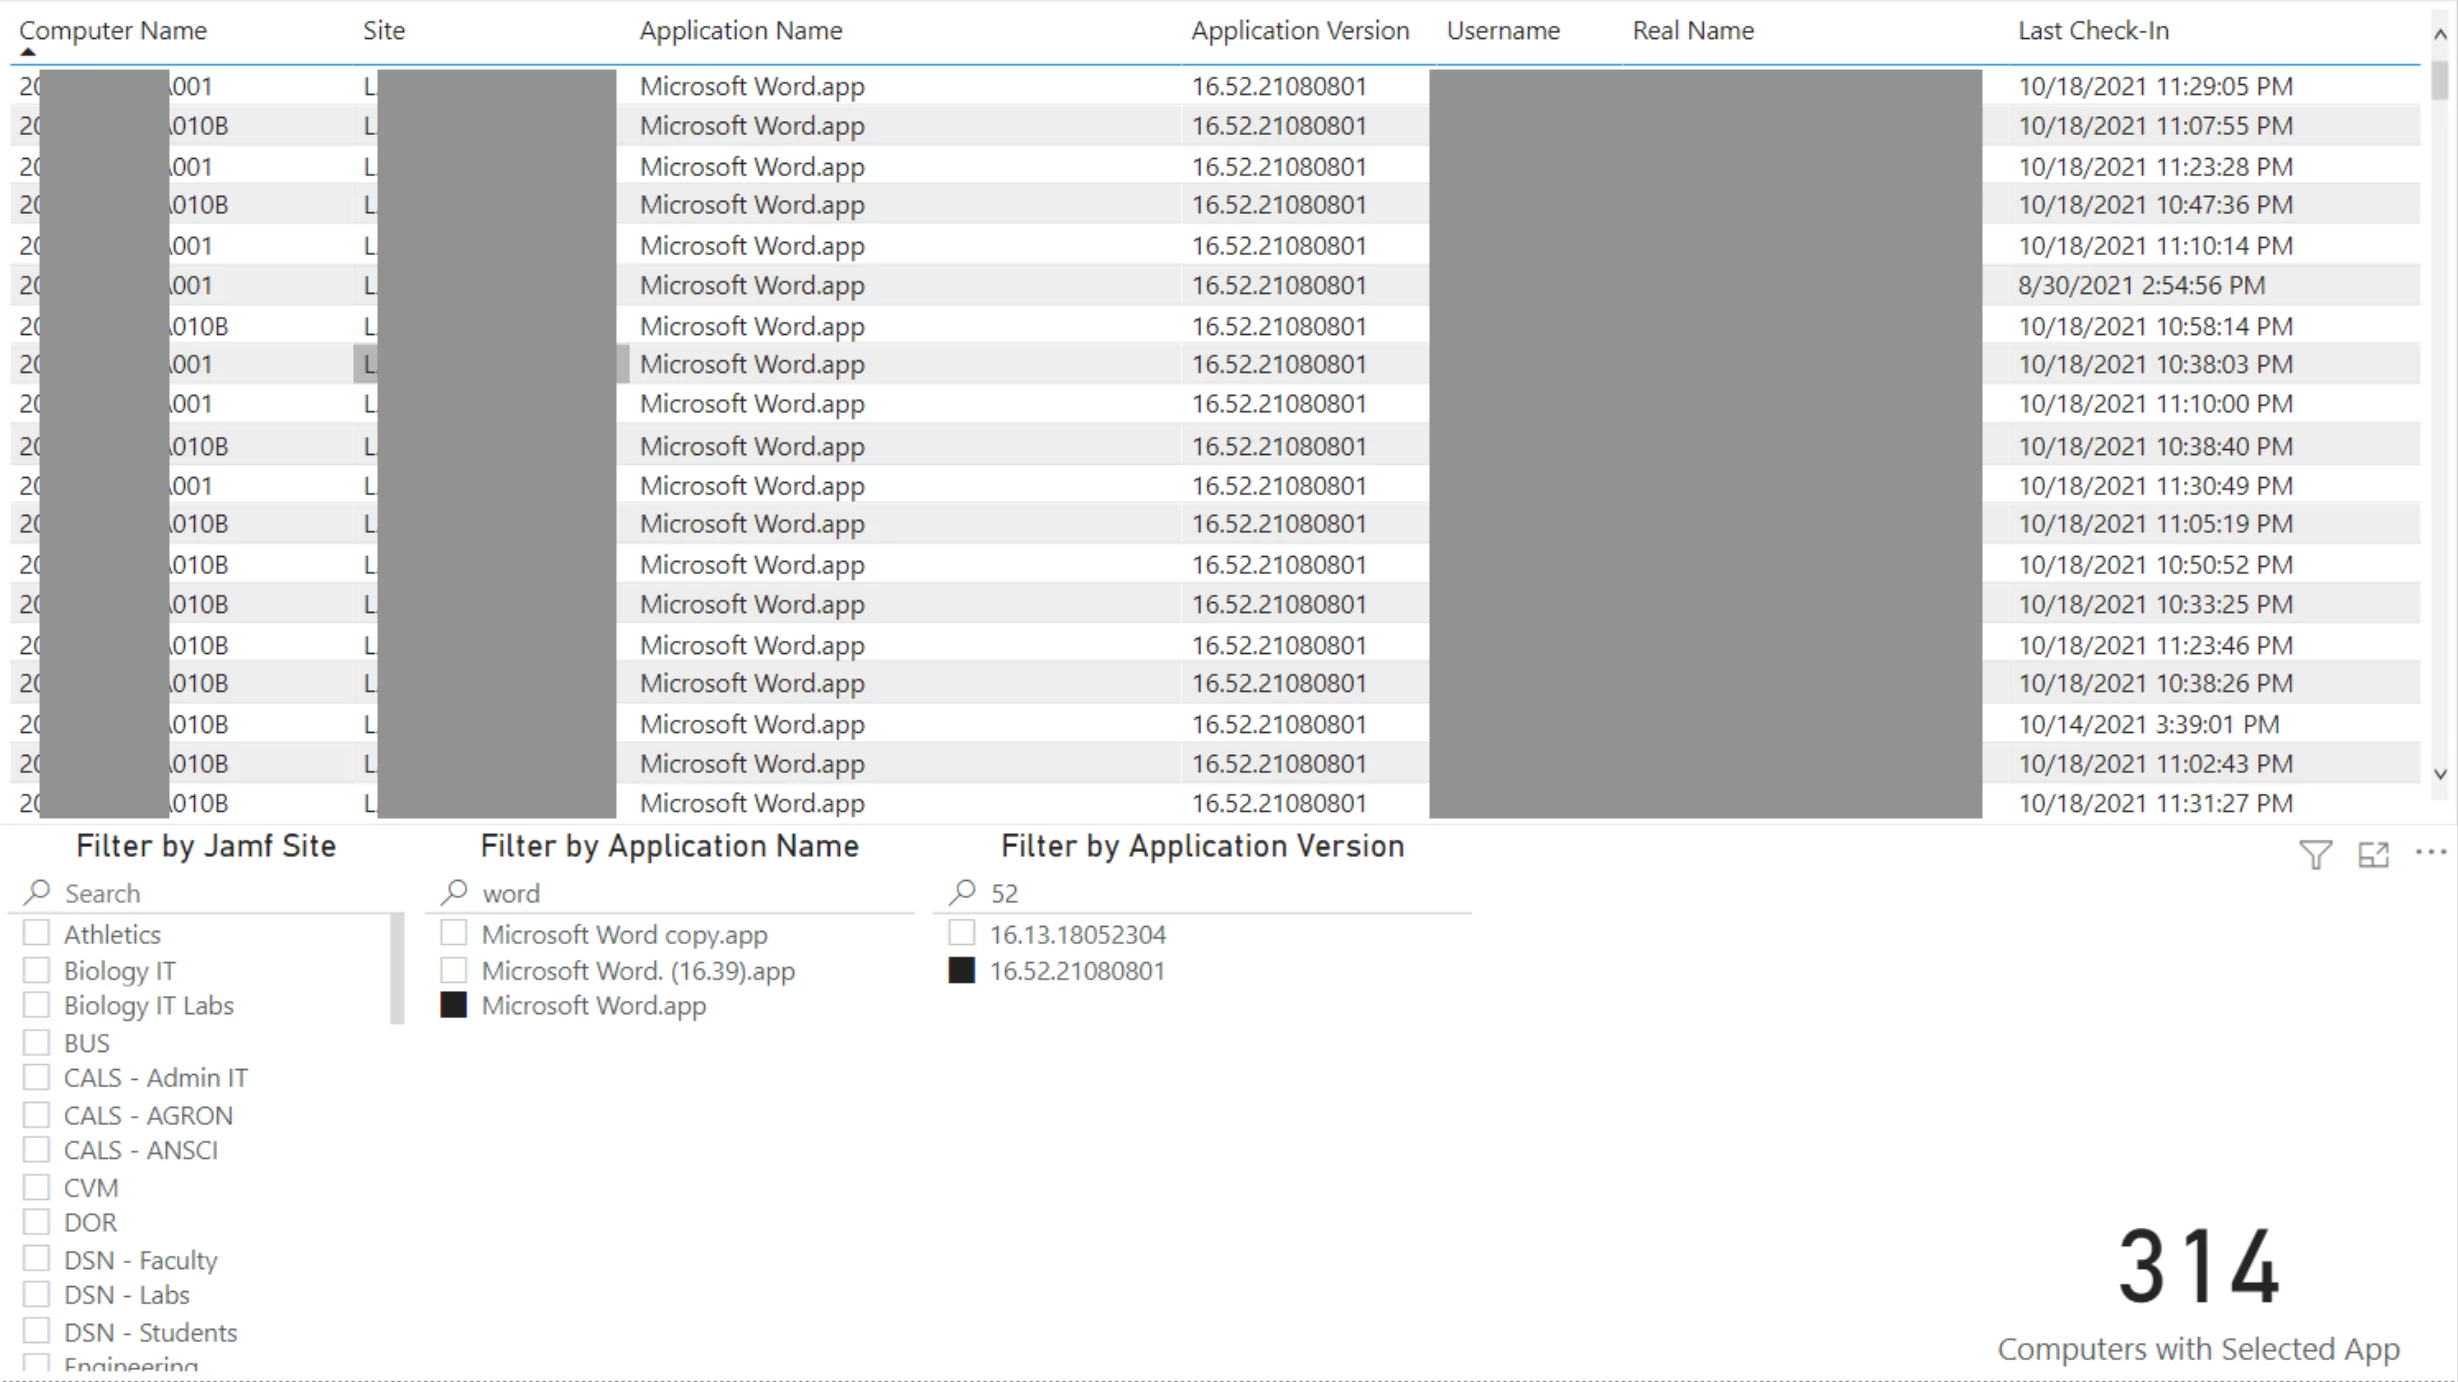
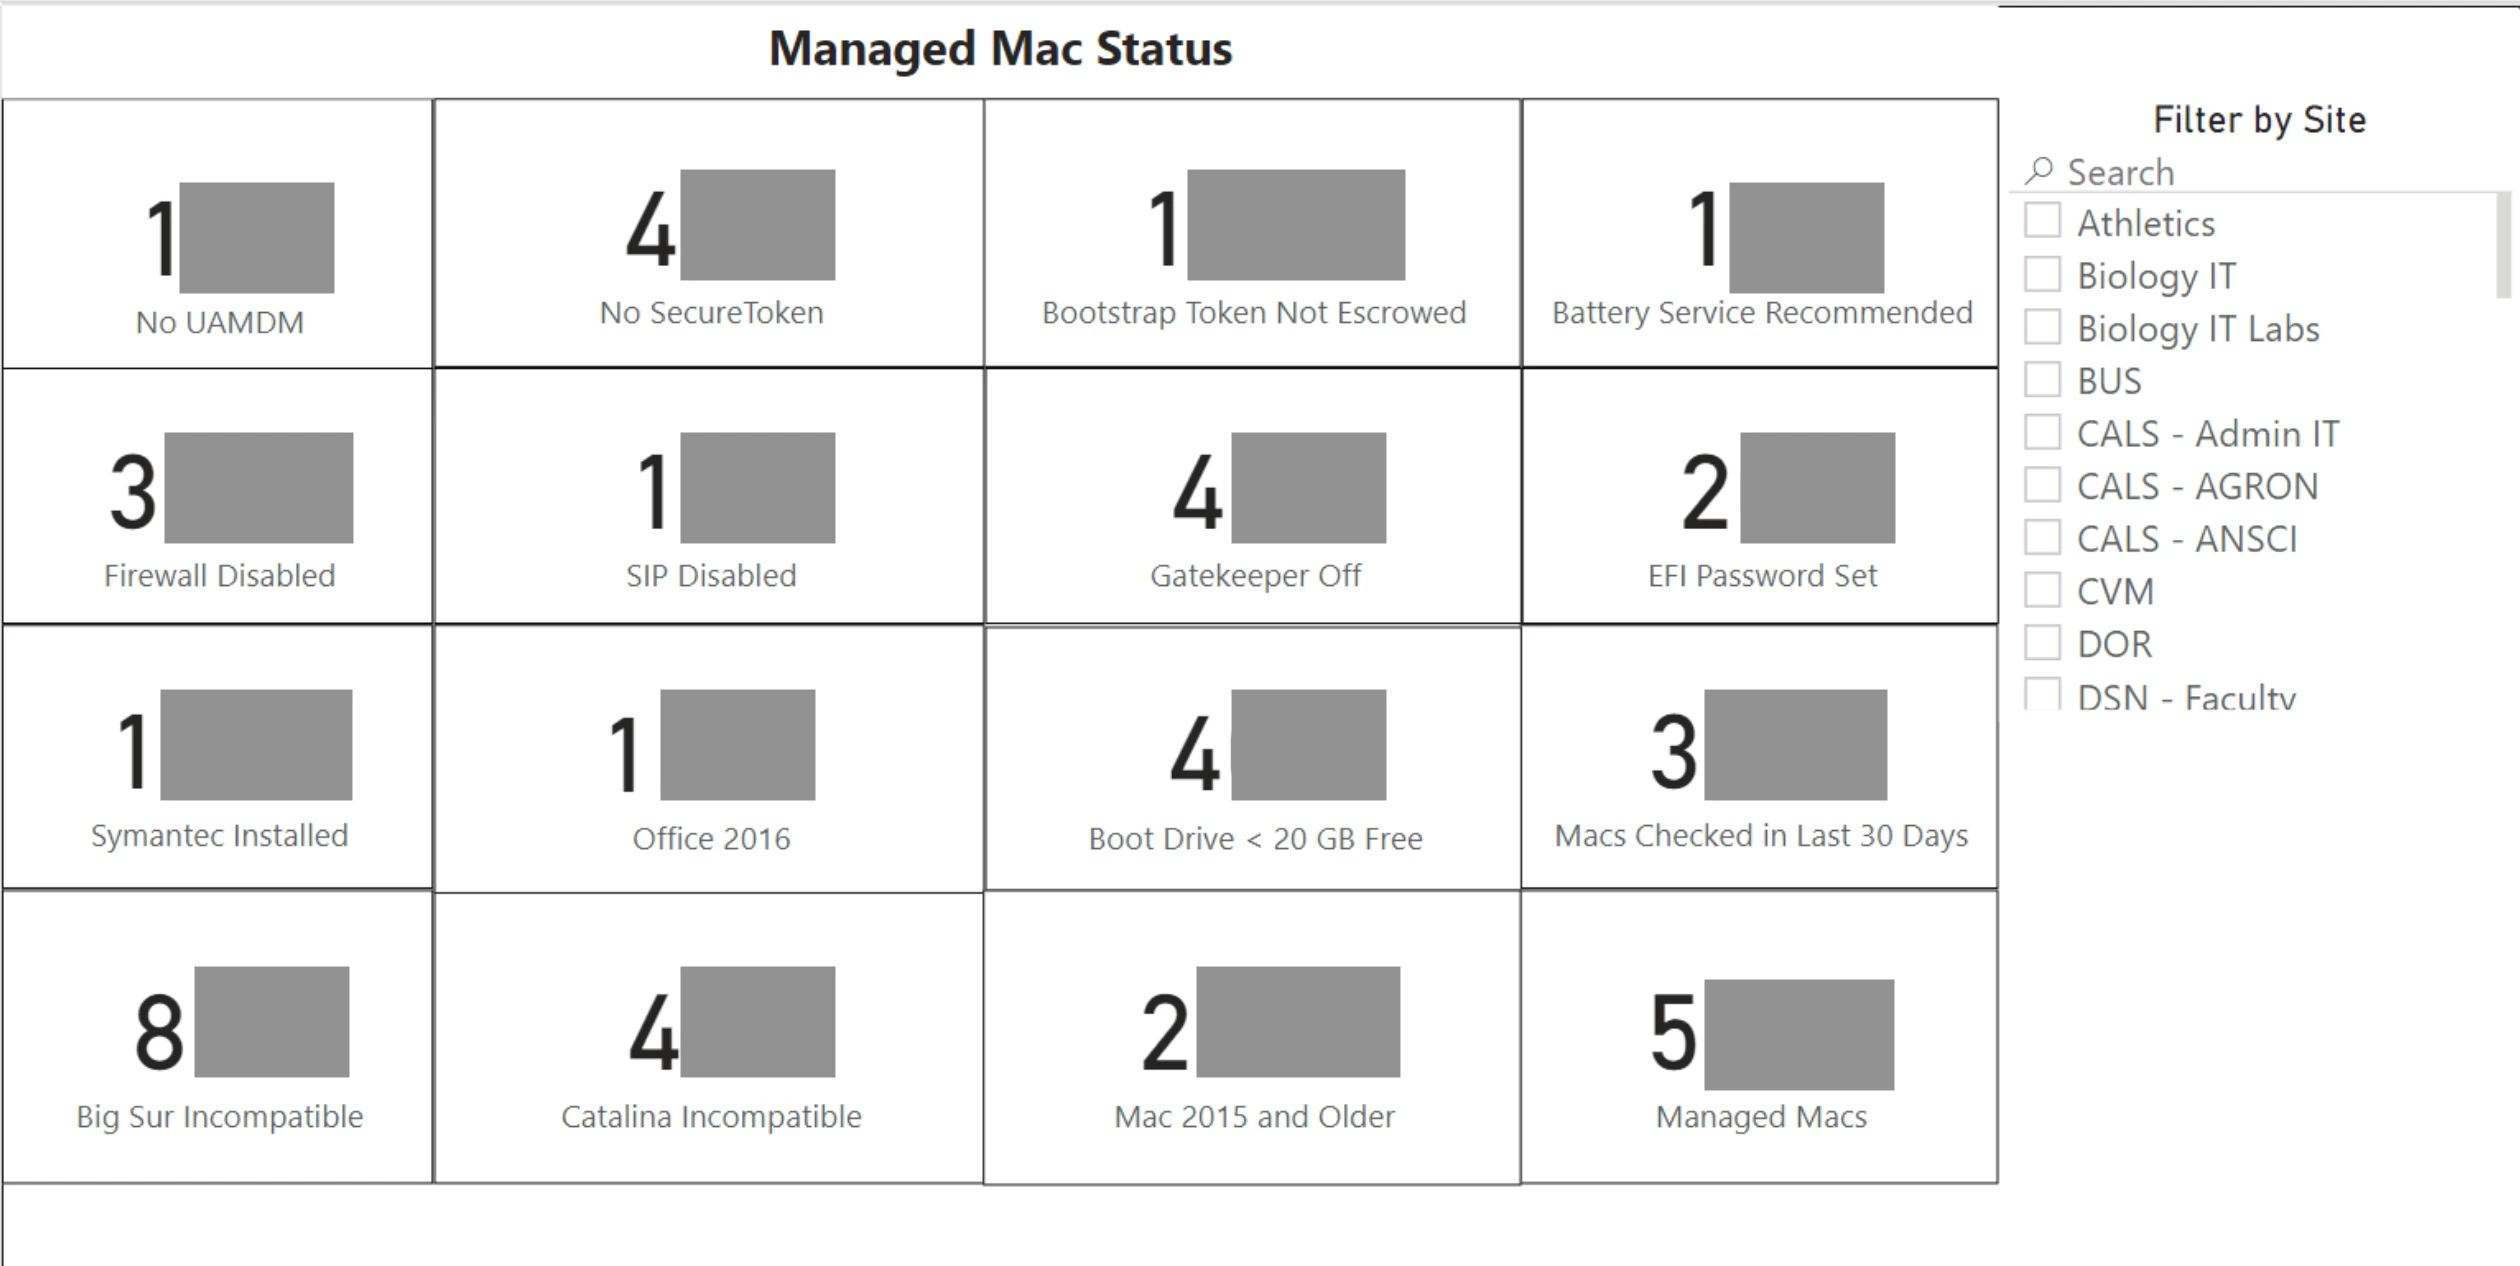
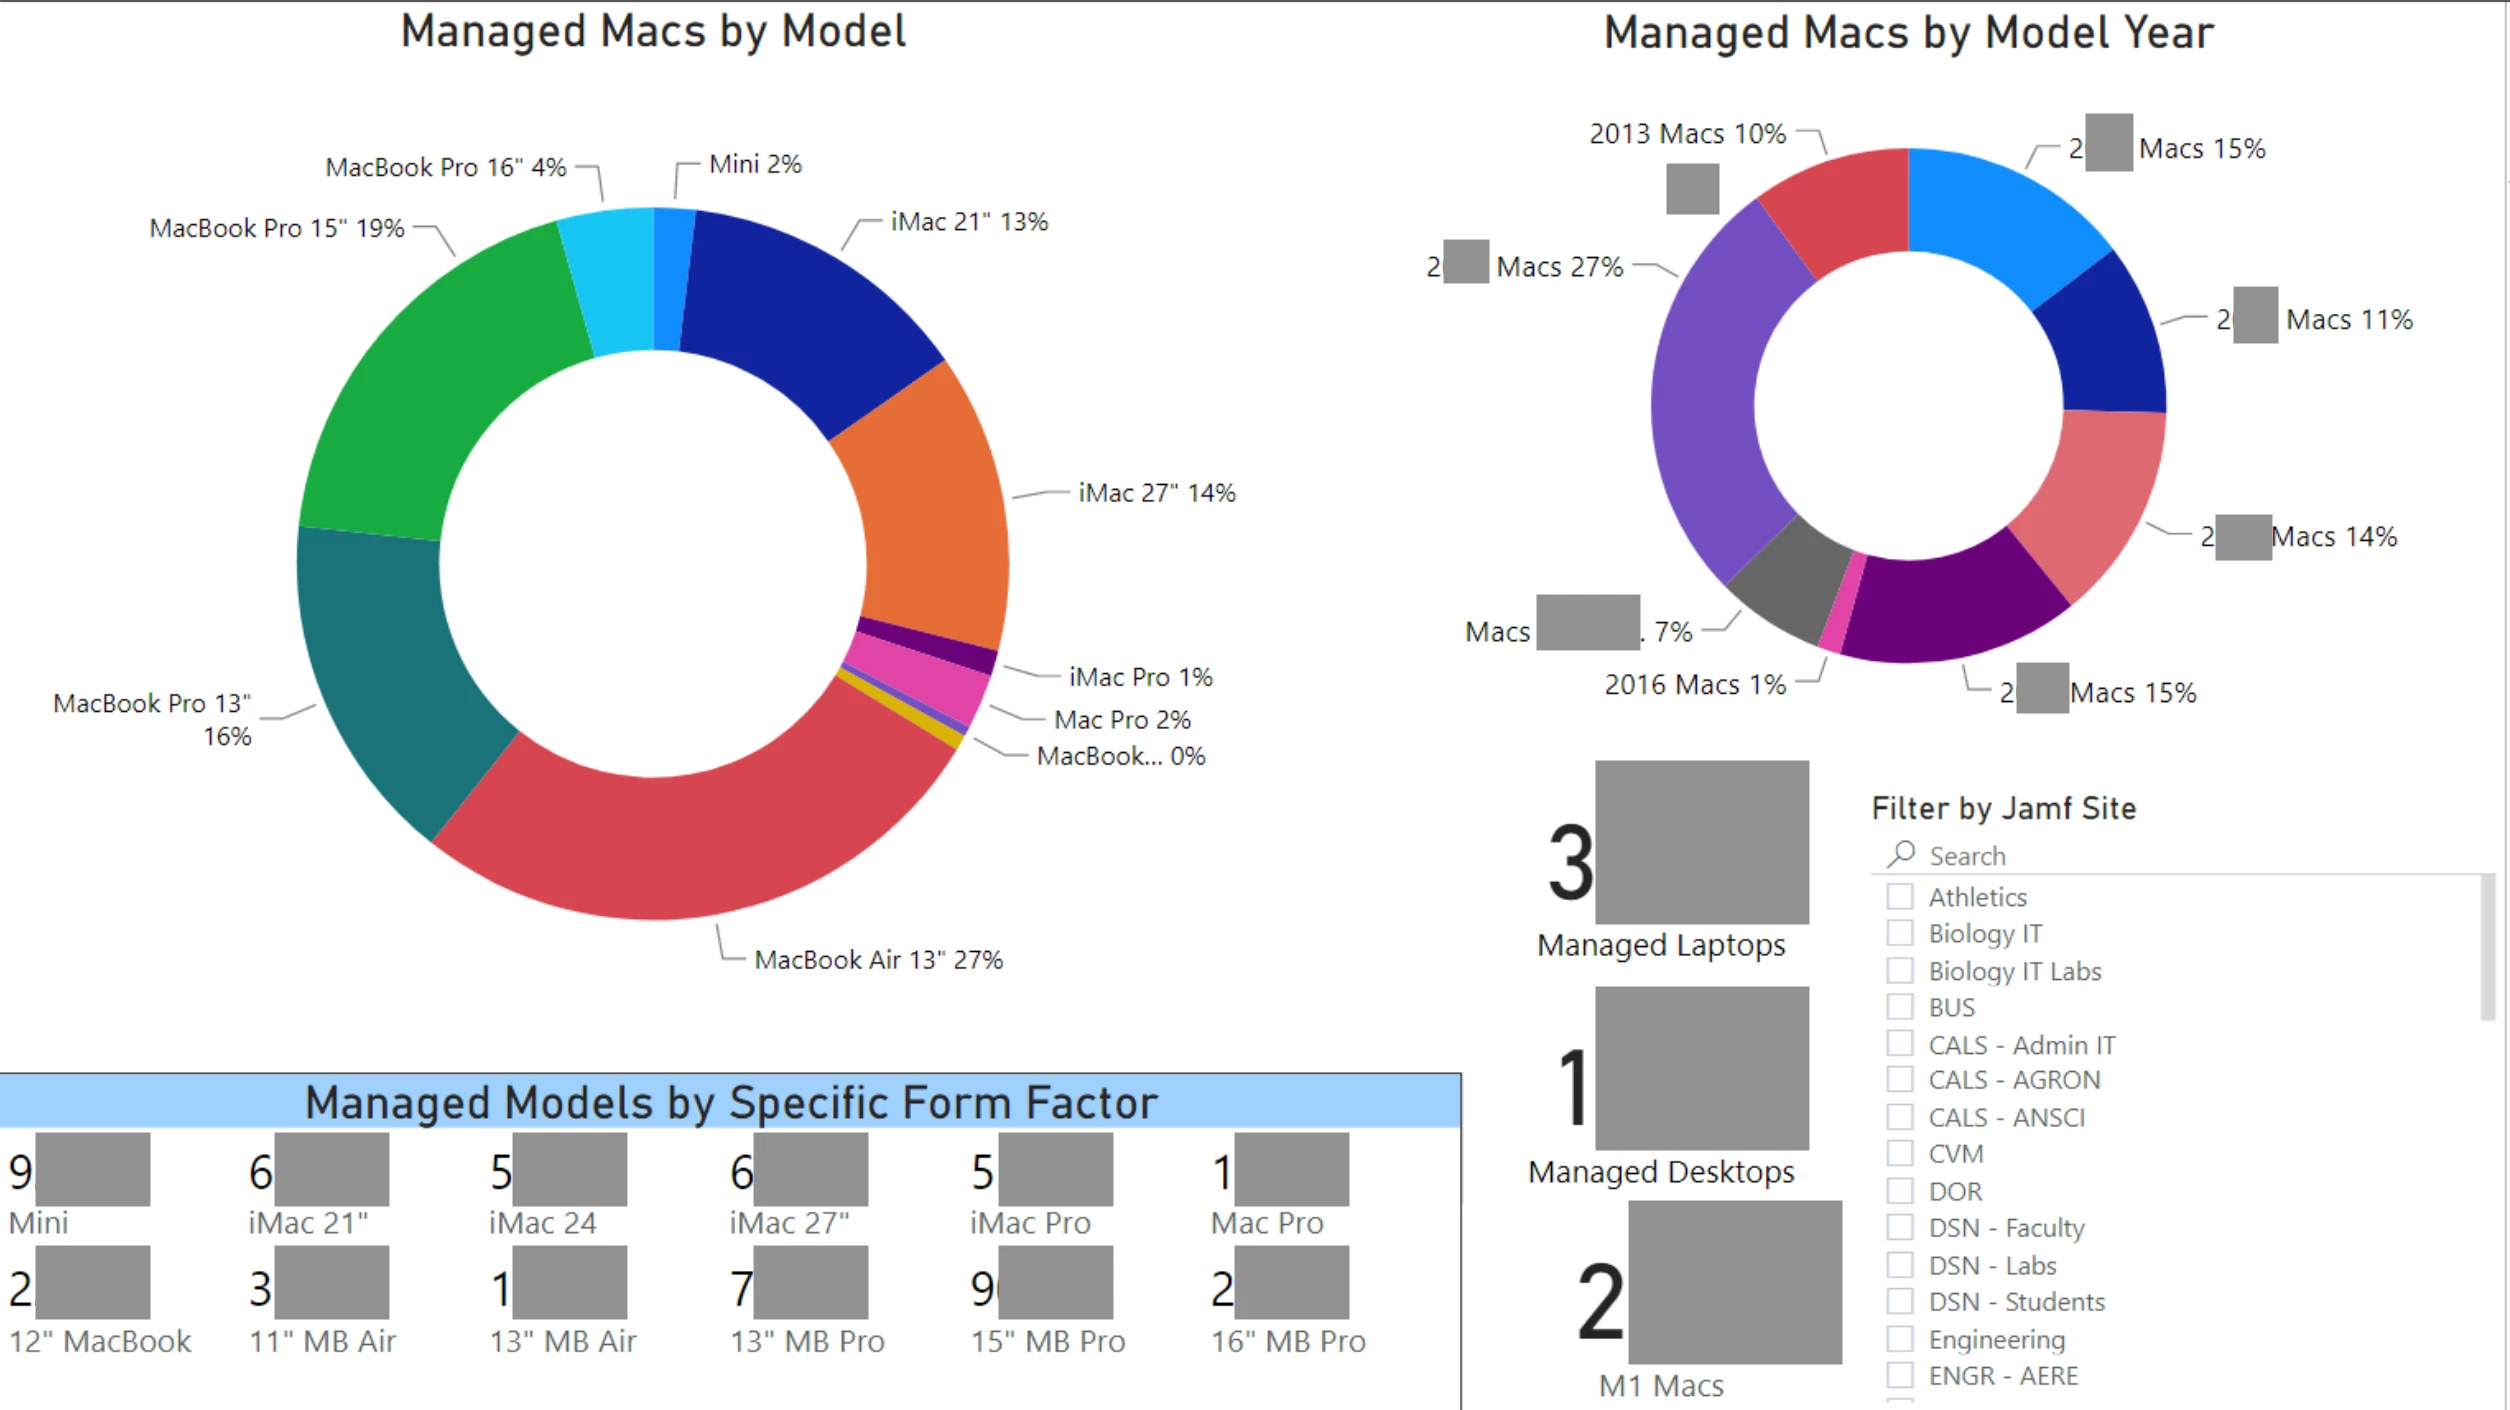
I did a talk today at JNUC 2021 on building dashboards in Power BI. Thanks to you all for sharing your dashboards and giving me inspiration on how to start on mine. I've got my slides out on https://github.com/technotica/PowerBI for anyone that wants to take a look at how I made them and tips and tricks on using Power BI with the Jamf Pro connector. 

I haven't found a way to export a template (.pbit) of my dashboards for mass consumption.  The main issues are that when I make a .pbit file it wants to retain my Jamf server information and it also retains queries specific to my Jamf environment, namely Extension Attributes.  Manually editing the pbit file is possible to share would be possible, but would require the person using it to do some manual editing too. It is all pretty sketchy. 


PowerBI-Summary.png


PowerBI-Enrollments.png


PowerBI-Application-Search.png


PowerBI-Big-Dashboard.png


PowerBI-Mac-Models.png


Hey great talk and great sildes. I'm currently trying to recreate your dashboard but failing with the enrolled in 30 Day and Checkin in 30Days Elements? Do you have a tip for the measures?


Best Regards


Colorenz

technotica
New Contributor II

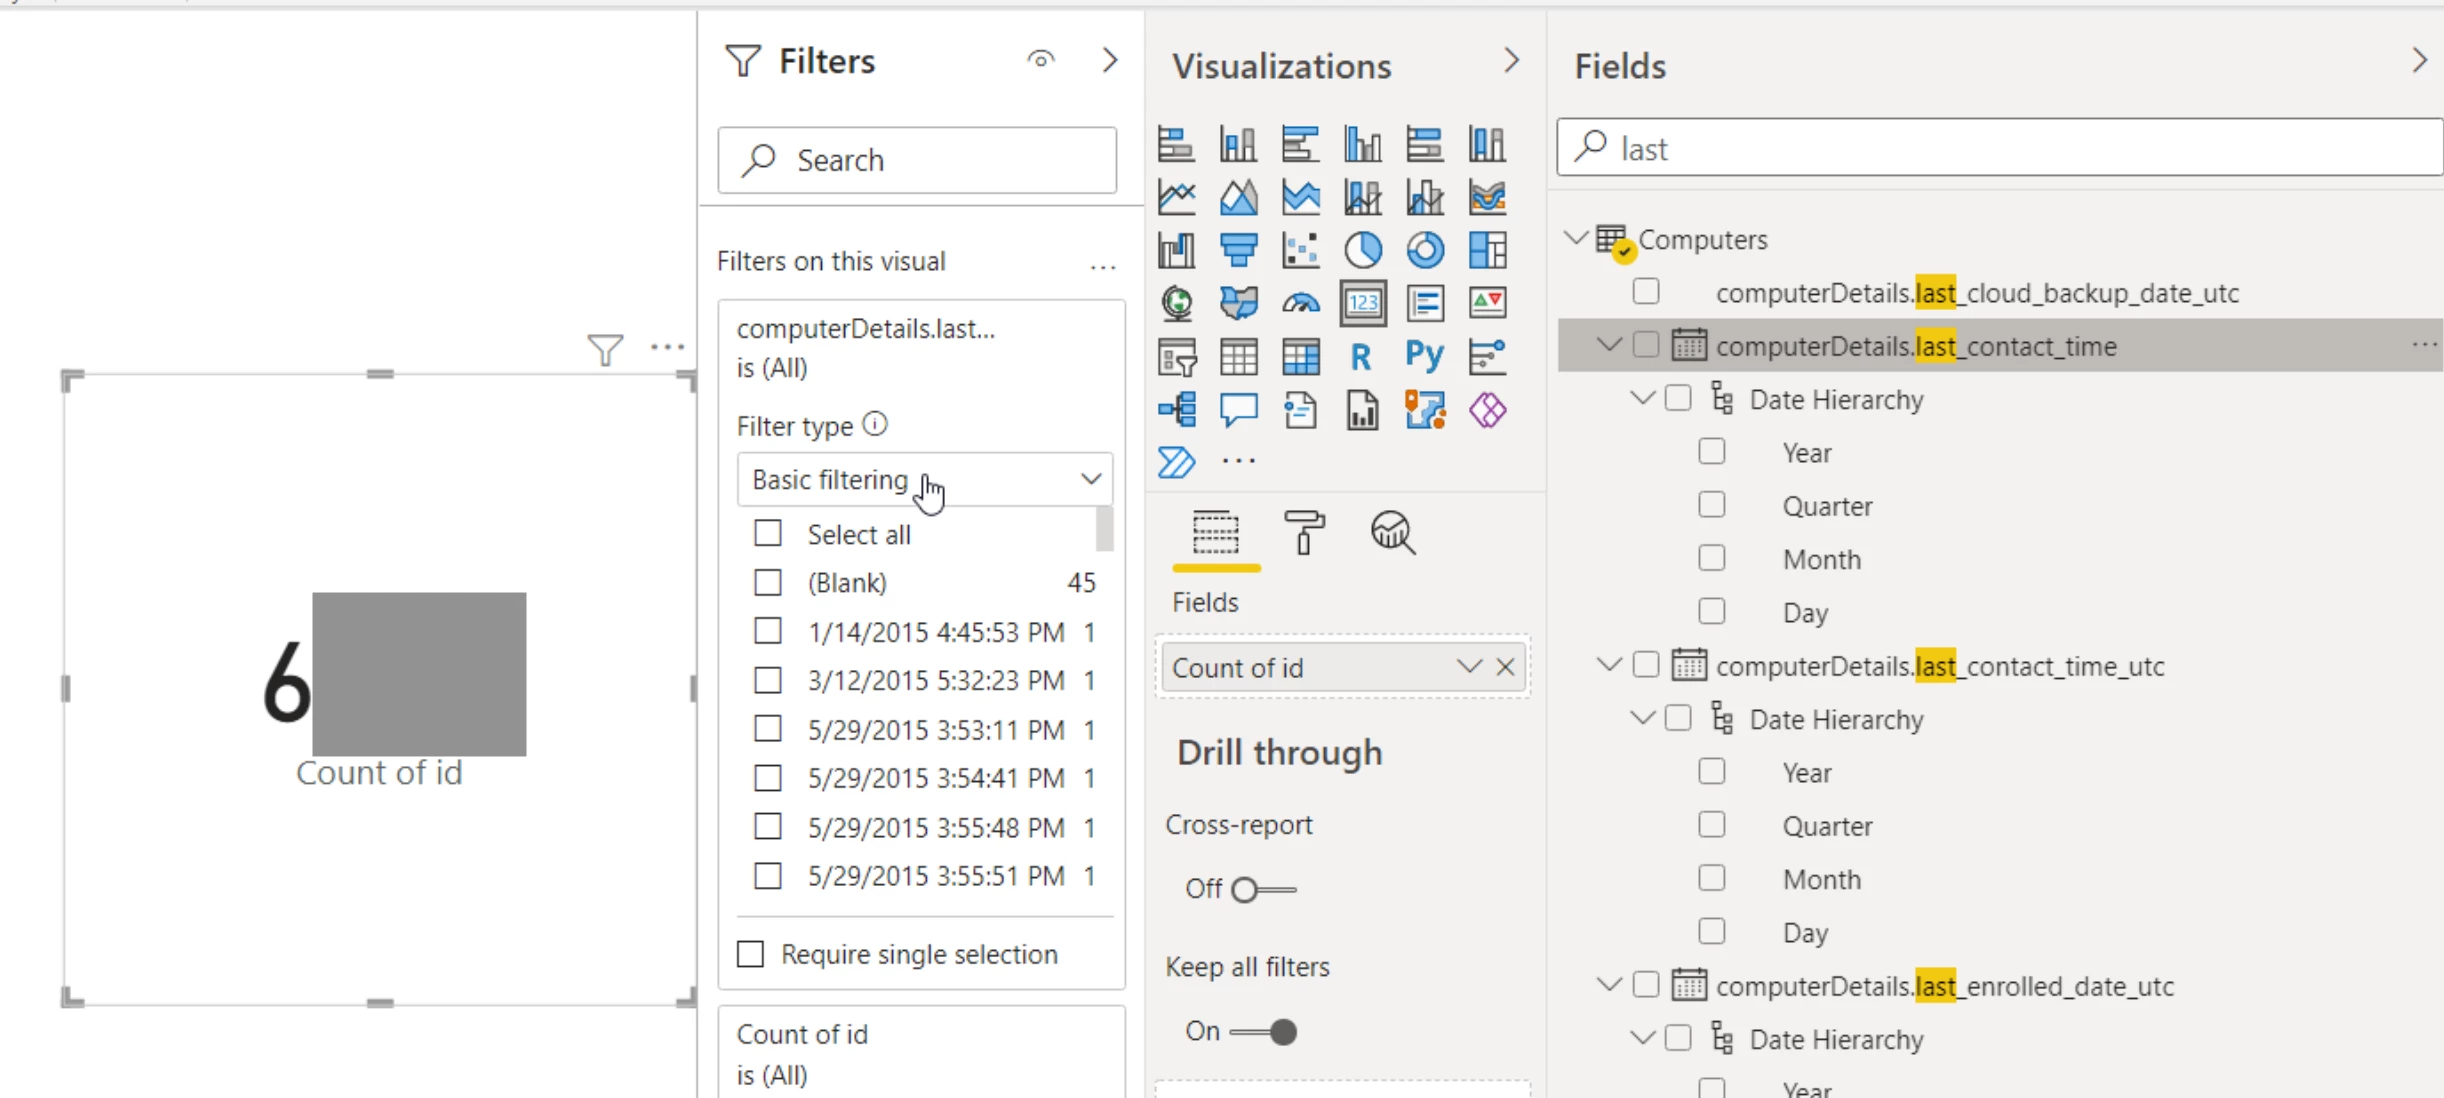
You don't need a measure to do this, what seems intimidating at first glance actually isn't too bad to implement :). It does require that you have your dates properly formatted, so take a look at my talk or slides on how to do that.

  1. Search for 'id' in the Fields category.
  2. Under Computers query, click and drag the id to the visualization page.
    1. Under the Visualizations column, click on the drop arrow for id and select Count
    2. Change the visualization to Card
    3. This will give you the entire count of Macs in your Jamf Pro environment.
  3. Search for 'last' in the Fields category
  4. Click and drag the computerDetails.last_contact_time into the Filters pane on top of the 'Add Data Fields Here'
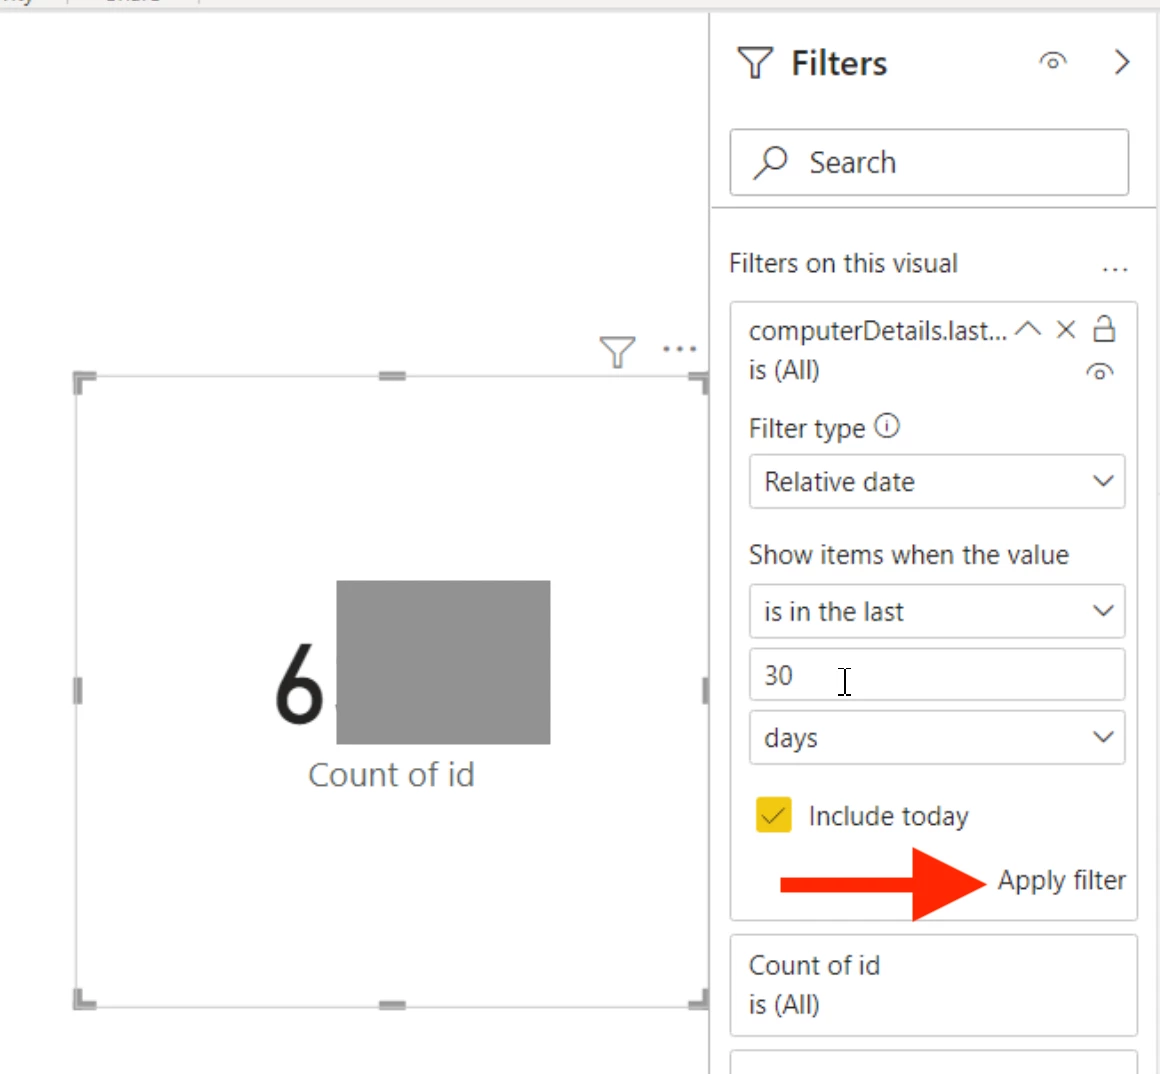
  5. Change the filter type from Basic Filtering to Relative Date.
  6. Set the 'is in the last' to however many days you want.
  7. Click Apply filter.

Now this card will be filtered on the relative date. Keep in mind if your data hasn't been refreshed in a while this number will not be accurate. 


Screen Shot 2021-10-30 at 5.08.18 PM.pngScreen Shot 2021-10-30 at 5.08.29 PM.png


Oh that was to simple for me😂. Thank you...

Have you found a way to activate the autoupdate for the reports on the web?

colorenz_0-1635700320584.png


wdrain01
New Contributor II
Hi Colorenz

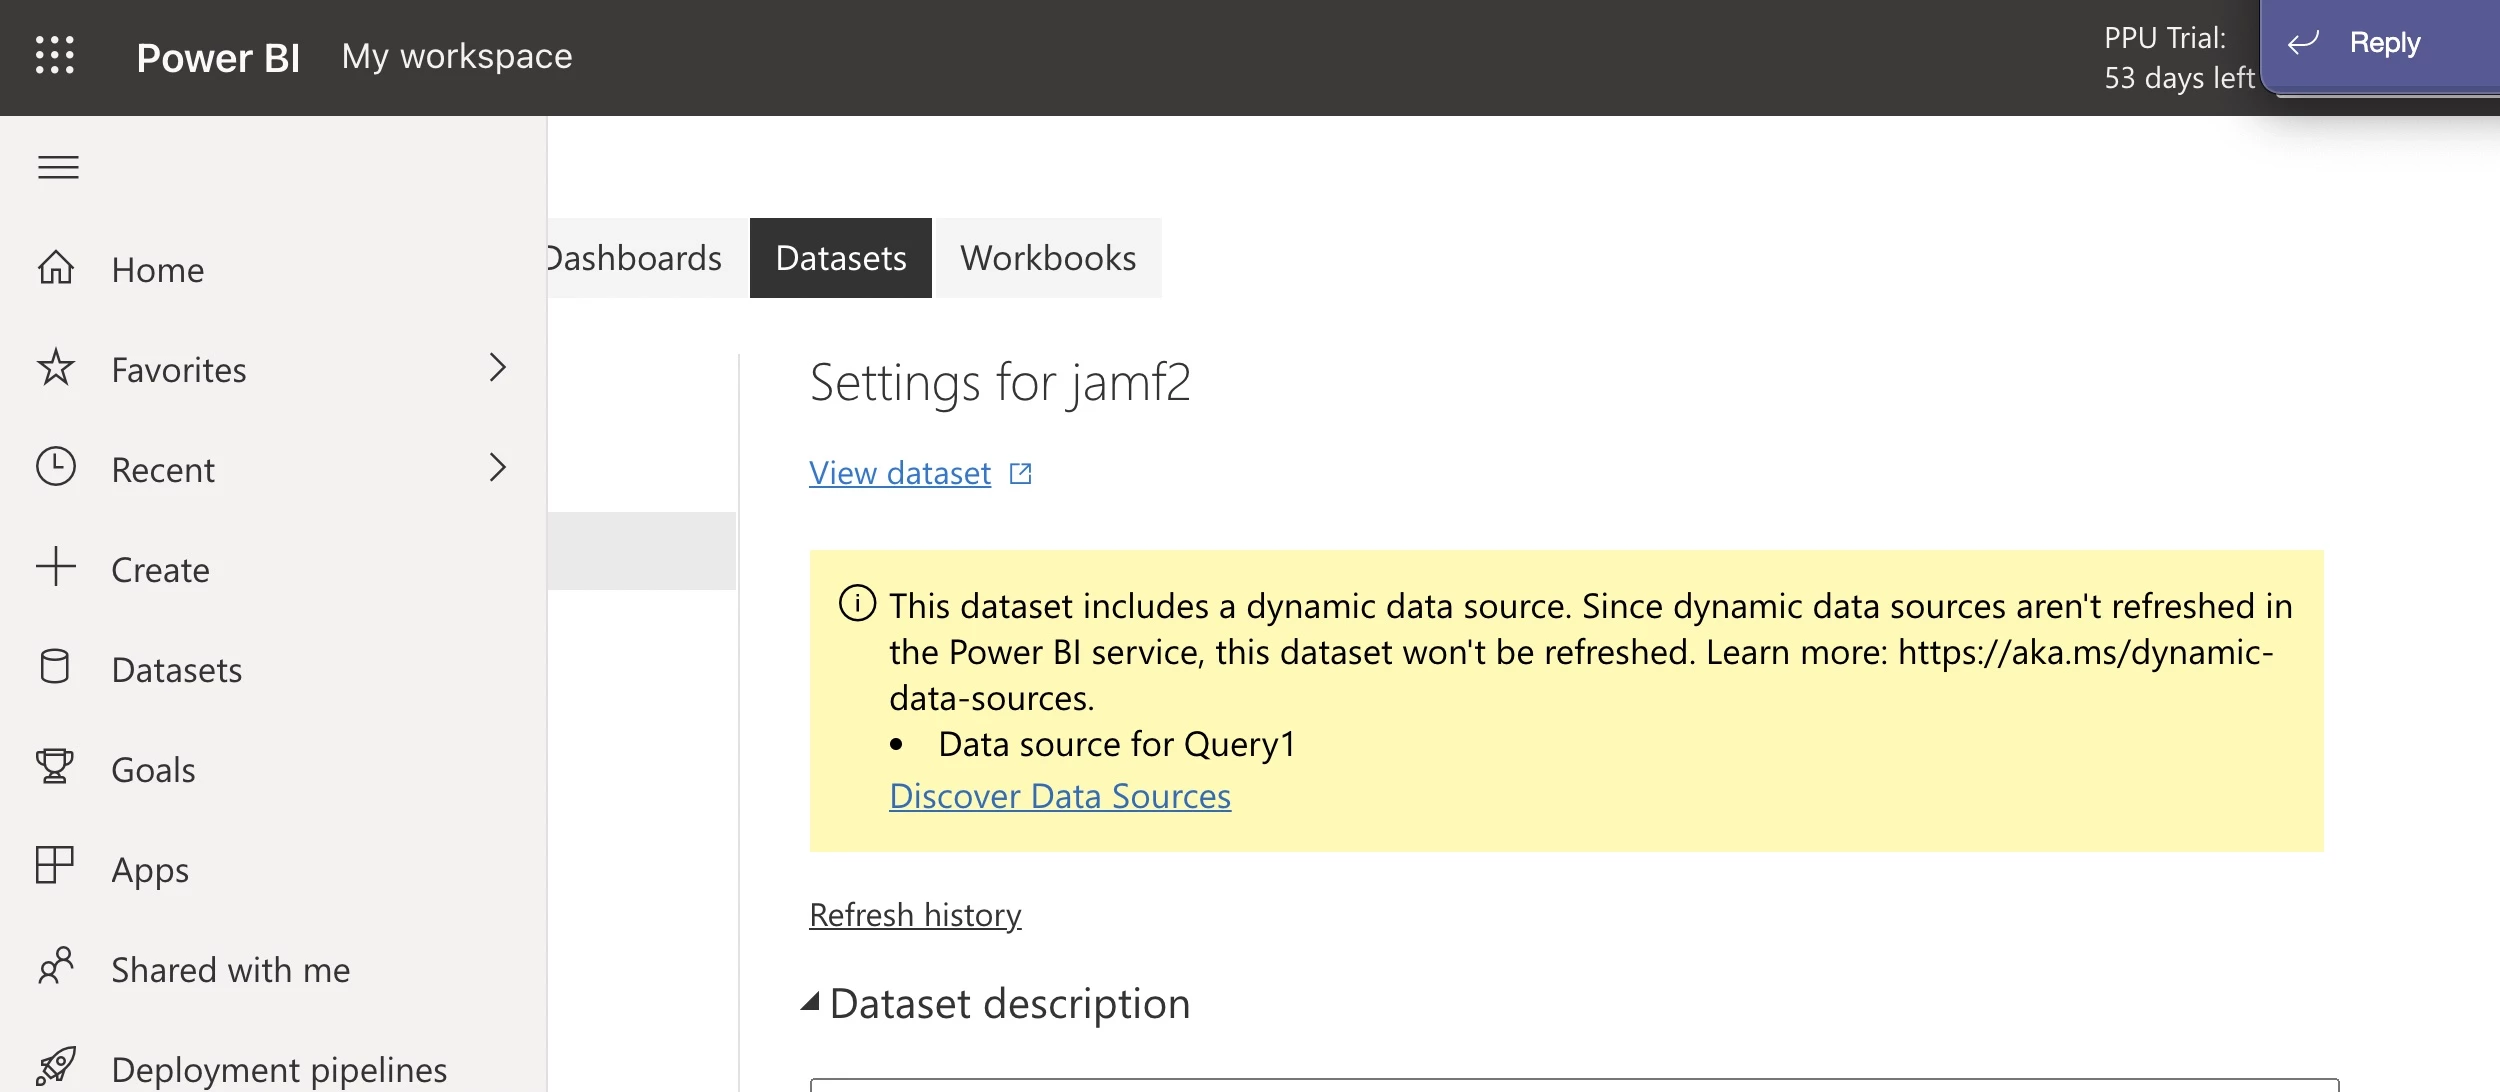
Just setup a Power BI gateway server. Once done you will be able to automate the data refresh of Jamf datasource

Here's the link to download Power BI gateway server and instructions
https://docs.microsoft.com/en-us/power-bi/connect-data/service-gateway-onprem

[cid:image001.png@01D7CE74.FA9A66B0]

JRM5513
New Contributor III

Here is our PowerBI view, inspired by all your dashboards. I would like to make a graph of the deployment of Monterey over time, but I feel like it's another level. Might be easier with Splunk.

cybertunnel
New Contributor II

To achieve that, I would recommend possibly doing a webhook which calls on a function or application that then writes to a database and then pull from there. An example might be: Smart Group named "Monterey" then a webhook that is called when "Membership changes". This webhook calls on a Power Automate flow which only runs if a machine is added to the group. This automation will write to a Sharepoint List with the date and the serial number. You can then pull that list and make a relationship on the Serial Number between the Computers data and the Monterey Serial data.

Habib-Rahman
New Contributor III

Hi Guys, looking at some of the cool stuff you have here I wanted to reach out and find out has anyone done anything with google data studios am trying to do the same dashboard reporting as you guys but haven’t found a way of getting the data over to Data studio to create these any help or tips would be very appreciated. Thank you  

oliver
New Contributor III
New Contributor III

A simple "csv" data upload might be a good place to start. Jamf Pro can export Computer or Mobile Device information via the Advanced Search feature and you can upload those to Data Studio as a Data Source.