- Jamf Nation Community
- Products
- Jamf Pro
- Re: parentalcontrolsd CPU/RAM Usage
- Subscribe to RSS Feed
- Mark Topic as New
- Mark Topic as Read
- Float this Topic for Current User
- Bookmark
- Subscribe
- Mute
- Printer Friendly Page
parentalcontrolsd CPU/RAM Usage
- Mark as New
- Bookmark
- Subscribe
- Mute
- Subscribe to RSS Feed
- Permalink
- Report Inappropriate Content
Posted on 04-22-2016 07:02 AM
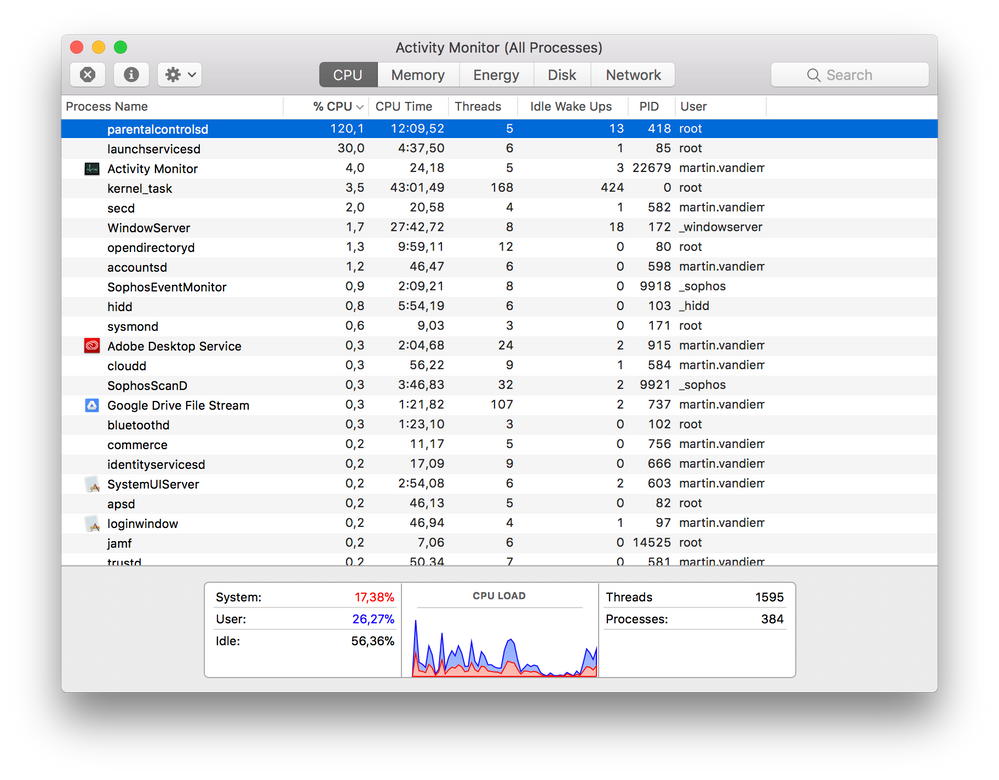
Hello all, I have ~150 Macs all bound through our AD, and also configured using Profile Manager. I don’t have anything out of the ordinary configured (Software Update, Munki URL, Screen Saver/Screen Lock) through profile manager, but I have several users with the parentalcontrolsd process either spiking their CPUs constantly, or in a couple cases, using ~6 GB RAM.
Anyone seen this issue or hopefully have a fix? Thanks so much in advance,
- Mark as New
- Bookmark
- Subscribe
- Mute
- Subscribe to RSS Feed
- Permalink
- Report Inappropriate Content
Posted on 07-11-2017 04:29 AM
I've heard of this issue but not experienced it myself. I've asked the users to create a sysdiagnose and reported it to Apple (Radar #33231868). Maybe it's a duplicate, maybe not, lets see!
- Mark as New
- Bookmark
- Subscribe
- Mute
- Subscribe to RSS Feed
- Permalink
- Report Inappropriate Content
Posted on 07-20-2017 11:03 AM
I have one reported user (our Dean, because of course it would be the Dean) with this issue, a MBP 2016 bound to AD. For good measure, I've wiped the drive and installed 10.12.6 – here's hoping?
- Mark as New
- Bookmark
- Subscribe
- Mute
- Subscribe to RSS Feed
- Permalink
- Report Inappropriate Content
Posted on 07-25-2017 10:41 AM
Just a follow up, a fellow JAMF admin posted in MacAdmins.slack.com that gathering app usage information was handled by parentalcontrolsd. In our case, we were collecting plug-in information enabled in Computer Inventory Collection. I've turned off that configuration and users with this problem have seen a great deal of improvement. parentalcontrolsd still runs on their system but no longer consumes high CPU resources. As with others our Macs were also AD bound. So this may not address all issues listed here.
- Mark as New
- Bookmark
- Subscribe
- Mute
- Subscribe to RSS Feed
- Permalink
- Report Inappropriate Content
Posted on 07-25-2017 12:03 PM
@Gonzalez, that is interesting! Have you reported this to Jamf Support maybe? Maybe they can investigate and file a Product Issue.
I've got feedback from Apple as well. The reported that the bug is a duplicate of #31942767 of therefor closed the case.
We've created the following script that will solved the issue (temporarily):
#!/usr/bin/env bash

# Reset Parental Controls
#
#
# Temp fix for macOS with high CPU on parentalcontrolsd

# Delete Settings
rm -fr "/Library/Application Support/Apple/ParentalControls"

# Kill proces
pkill -9 parentalcontrolsd- Mark as New
- Bookmark
- Subscribe
- Mute
- Subscribe to RSS Feed
- Permalink
- Report Inappropriate Content
Posted on 07-26-2017 05:10 AM
Our temporarily fix will not solve the issue. We now have unchecked "Collect Plug-ins" from Computer Inventory Collection to see if this might solve the issue.
- Mark as New
- Bookmark
- Subscribe
- Mute
- Subscribe to RSS Feed
- Permalink
- Report Inappropriate Content
Posted on 07-26-2017 10:07 AM
@martin Yes, I have an open case with Jamf. And I still have an open case with Enterprise AppleCare hoping to get some final resolution once Jamf comes back with an appropriate response. Others have suggested not collecting any of the software usage stats. If you collect anything in the Software configuration panel from the Computer Inventory Collection, you may need to disable.
- Mark as New
- Bookmark
- Subscribe
- Mute
- Subscribe to RSS Feed
- Permalink
- Report Inappropriate Content
Posted on 07-27-2017 08:01 AM
Hi @Gonzalez,
We have seen this in two environments. One has "Collect Application Usage Information" turned on and the other has it turned off. So it seems that this option doesn't make a difference.
- Martin
- Mark as New
- Bookmark
- Subscribe
- Mute
- Subscribe to RSS Feed
- Permalink
- Report Inappropriate Content
Posted on 08-01-2017 05:10 PM
Also seeing this on 10.12.6.
- Mark as New
- Bookmark
- Subscribe
- Mute
- Subscribe to RSS Feed
- Permalink
- Report Inappropriate Content
Posted on 08-10-2017 06:38 AM
@jamescchh Seeing this on 10.2.5 .. updating to 10.12.6 later today to see what happens. I can watch the memory usage go up over time. It will max out at 15 or so gb out of 16
- Mark as New
- Bookmark
- Subscribe
- Mute
- Subscribe to RSS Feed
- Permalink
- Report Inappropriate Content
Posted on 08-11-2017 02:30 AM
Could you let us know if you have "Collect Application Usage Information" and/or "Collect Plug-ins" turn on?
Thanks!
- Mark as New
- Bookmark
- Subscribe
- Mute
- Subscribe to RSS Feed
- Permalink
- Report Inappropriate Content
Posted on 08-21-2017 11:58 AM
Having this issue in 10.12.6. 39.5GB of memory being used by parentalcontrolsd. Wondered why my laptop was being whiny. Killing the process seems to have provided temporary relief.
- Mark as New
- Bookmark
- Subscribe
- Mute
- Subscribe to RSS Feed
- Permalink
- Report Inappropriate Content
Posted on 08-30-2017 06:26 AM
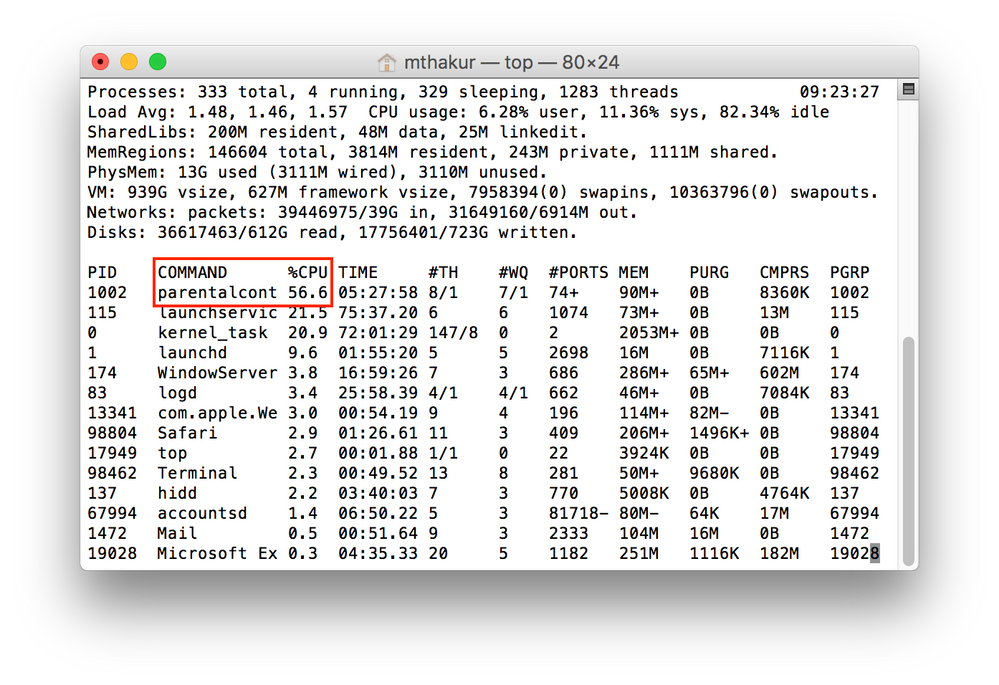
I'm definitely seeing parentalcontrolsd spiking, and one cause for it is definitely app usage statistics gathering by the JSS.
How to reproduce:
- Open /Applications/Utilities/Terminal.app and move its window to the side of your Mac's screen, keeping its window visible.
- Enter:
top -uat the Terminal prompt and press return. (The top command shows the Mac's Unix process table, sorted by cpu usage and updated constantly.) - Now click on a different app's window — can be any other running app.
- In the Terminal window, watch under the COMMAND column for parentalcontrolsd to spike to top of cpu usage list and then drop again.
- If you missed it, simply click on any other app, while watching the Terminal window. This is endlessly repeatable.
- To exit the test, enter
ctrl-cin the Terminal window. (This will terminate the top command. You can also quit Terminal.app if you don't need to use it further.)
Note: To trigger the cpu spike, you have to click on an entirely different app, e.g. from Safari to Mail. Switching among multiple open windows or tabs within the same app (e.g. Safari) will not trigger the cpu spike.
- Mark as New
- Bookmark
- Subscribe
- Mute
- Subscribe to RSS Feed
- Permalink
- Report Inappropriate Content
Posted on 09-06-2017 02:41 PM
This has dragged on forever with absolutely no progress, it seems. Is it ever going to get resolved?
- Mark as New
- Bookmark
- Subscribe
- Mute
- Subscribe to RSS Feed
- Permalink
- Report Inappropriate Content
Posted on 09-19-2017 02:14 AM
Just found this discussion.. we have the same problem on a 15" MacBook Pro, running macOS 10.12.6... :-(
- Mark as New
- Bookmark
- Subscribe
- Mute
- Subscribe to RSS Feed
- Permalink
- Report Inappropriate Content
Posted on 09-26-2017 02:22 AM
I recently got the problem myself (with 10.13 GM). When opening or closing Safari parentalcontrolsd was using a lot of CPU:
@Gonzalez pointed out he hasn't seen the problem when removing the Configuration Profile with a Security & Privacy payload. I've excluded my Mac from the Configuration Profile (it only contains Security & Privacy) after which I have not seen the issue. I removed my Mac from the exclusion and have seen the issue reappear.
This issue doesn't not always take place. I witnessed the issue myself now and it looks like the Security & Privacy payload causes the issue. Maybe other Jamf Nation users can confirm?
- Mark as New
- Bookmark
- Subscribe
- Mute
- Subscribe to RSS Feed
- Permalink
- Report Inappropriate Content
Posted on 09-29-2017 11:03 AM
What I’ve found is that some configuration profiles cause the parentalcontrolsd process to seemingly hang. What has finally resolved this is to use more discrete configuration profiles for specific settings we want to enforce. Using something bundled like the Security & Privacy configuration profile provided by Jamf causes the problem. In our environment, a custom payload for Safari also causes the problem. For Security & Privacy, I’ve had to test each setting individually and create a custom payload. For Safari, I’ve moved to scripting preferences. Doing this has allowed the parentalcontrolsd process to shutdown shortly after boot.
- Mark as New
- Bookmark
- Subscribe
- Mute
- Subscribe to RSS Feed
- Permalink
- Report Inappropriate Content
Posted on 10-23-2017 02:16 PM
I exempted myself from any login window, security, or safari config profile and was still seeing the issue. I also have all app usage,font, and plugin inventory collection disabled.
however, killing the process does work (till reboot). Will be very interested to know what the root cause/fix (if any) is.
- Mark as New
- Bookmark
- Subscribe
- Mute
- Subscribe to RSS Feed
- Permalink
- Report Inappropriate Content
Posted on 11-02-2017 10:52 AM
We've had a support case with Apple for a number of months. I was just informed the problem has been addressed with 10.13.2 beta 1. I have not validated but wanted to share with others should they have the opportunity to check.
- Mark as New
- Bookmark
- Subscribe
- Mute
- Subscribe to RSS Feed
- Permalink
- Report Inappropriate Content
Posted on 01-26-2018 07:04 AM
Are there any updates on this issue. We have a few users with the same problem. We have been avoiding High Sierra, but if 10.13.3 has fixed it, I'd be willing to test it out on a couple users.
- Mark as New
- Bookmark
- Subscribe
- Mute
- Subscribe to RSS Feed
- Permalink
- Report Inappropriate Content
Posted on 03-28-2018 06:26 AM
Any update on this yet? I have a few users that reported this issue.
- Mark as New
- Bookmark
- Subscribe
- Mute
- Subscribe to RSS Feed
- Permalink
- Report Inappropriate Content
Posted on 06-04-2018 02:32 PM
Any updates?
- Mark as New
- Bookmark
- Subscribe
- Mute
- Subscribe to RSS Feed
- Permalink
- Report Inappropriate Content
Posted on 10-08-2018 02:04 AM
Hi all,
Without going into details, the problem is still there on 10.13.6, i have open case with AppleSupport, at present there is no answer to this issue, just try Mojave....
- Mark as New
- Bookmark
- Subscribe
- Mute
- Subscribe to RSS Feed
- Permalink
- Report Inappropriate Content
Posted on 03-19-2019 02:34 PM
Anyone have any solutions to this that work long term? Does Mojave fix the problem?
- Mark as New
- Bookmark
- Subscribe
- Mute
- Subscribe to RSS Feed
- Permalink
- Report Inappropriate Content
Posted on 03-20-2019 05:17 AM
@DanGio yep, it does, we don't see such behavior on 10.14.x

