- Jamf Nation Community
- Products
- Jamf Pro
- Re: Show off your reporting dashboard!
- Subscribe to RSS Feed
- Mark Topic as New
- Mark Topic as Read
- Float this Topic for Current User
- Bookmark
- Subscribe
- Mute
- Printer Friendly Page
Show off your reporting dashboard!
- Mark as New
- Bookmark
- Subscribe
- Mute
- Subscribe to RSS Feed
- Permalink
- Report Inappropriate Content
Posted on 05-04-2020 03:31 PM
Jamf Pro has built-in dashboards, but many admins want the flexibility of Business Intelligence (BI) or reporting tools. JNUC 2019 introduced integrations with some of the most popular tools. We have been hard at work creating resources to help you get the most out of your data, and now we want to see your dashboard!
If you have a great dashboard to share, please post it here! If you have tips or tricks that helped you build it, share it with your fellow admins. Remember to sanitize any sensitive data before posting.
- Mark as New
- Bookmark
- Subscribe
- Mute
- Subscribe to RSS Feed
- Permalink
- Report Inappropriate Content
Posted on 05-05-2020 07:03 AM
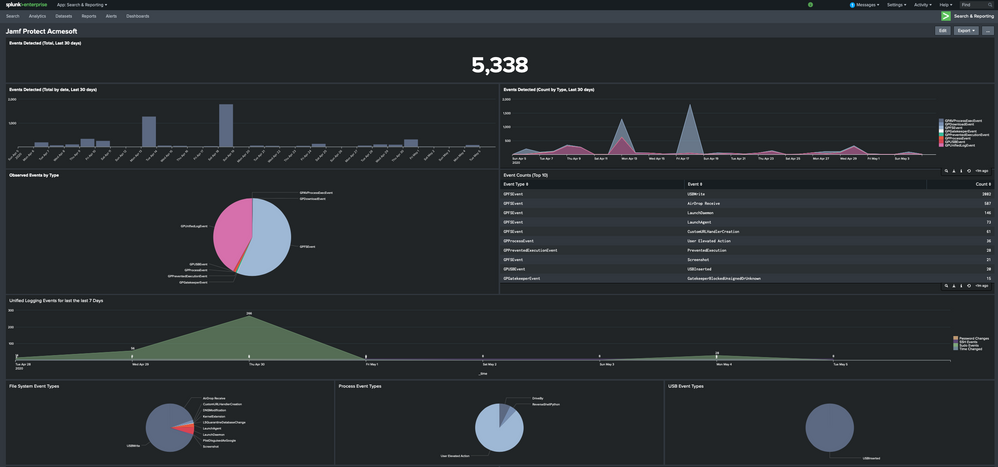
This is an example dashboard that I use for Jamf Protect with Splunk! I know that using Splunk as a SIEM is a standard for most SOCs and the data was easy to search and create visualizations. Really looking forward to see others dashboards for inspiration!
- Mark as New
- Bookmark
- Subscribe
- Mute
- Subscribe to RSS Feed
- Permalink
- Report Inappropriate Content
Posted on 05-05-2020 07:41 AM
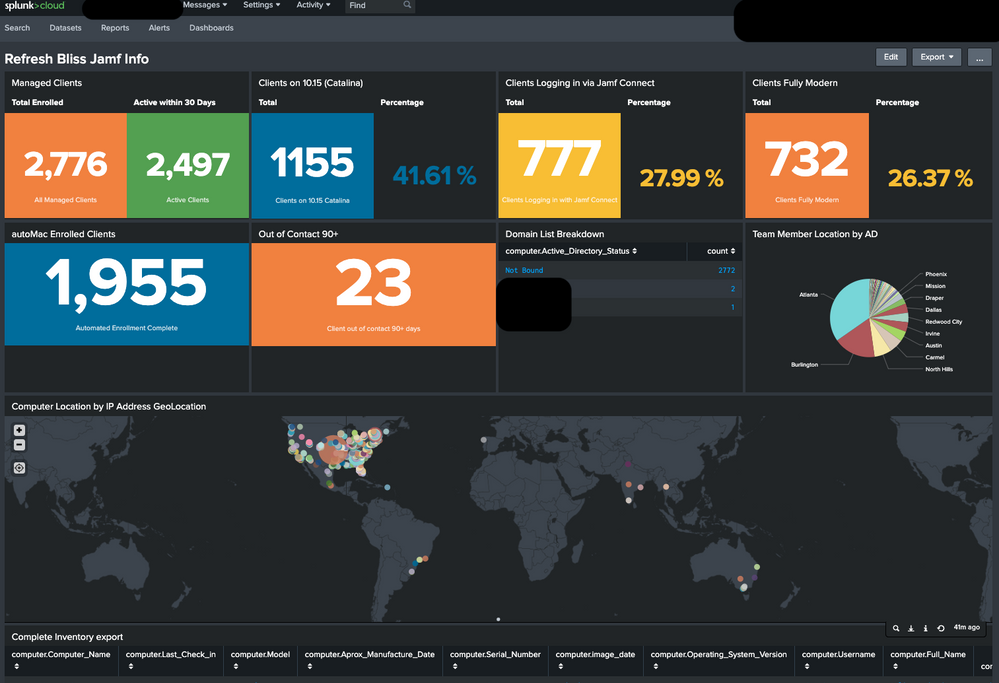
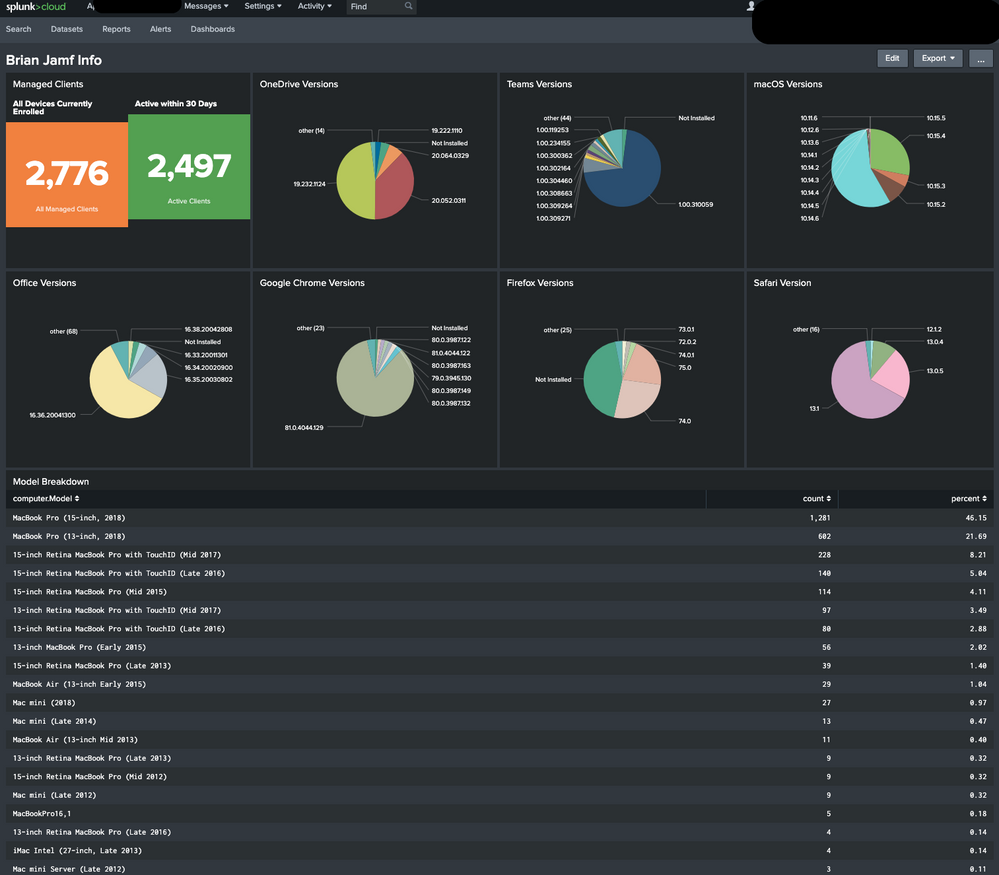
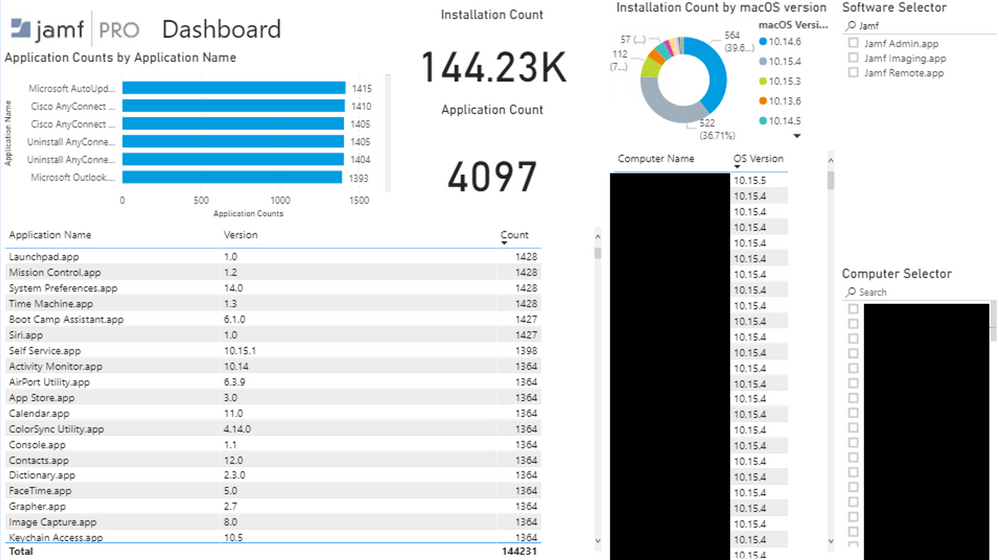
Here are a some we use.
- Mark as New
- Bookmark
- Subscribe
- Mute
- Subscribe to RSS Feed
- Permalink
- Report Inappropriate Content
Posted on 05-05-2020 10:07 AM
Mind sharing the search string that split off the App Versions from the app?
- Mark as New
- Bookmark
- Subscribe
- Mute
- Subscribe to RSS Feed
- Permalink
- Report Inappropriate Content
Posted on 05-05-2020 10:29 AM
assuming you have the jamf splunk plugin installed. We have an Extension Attribute to pull versions of the apps we care about. Those EAs are listed in the advance search that splunk reads. Then its a pretty simple search:
index=name sourcetype=JamfModularInput | rare limit=20000 "computer.*EA_Name*"- Mark as New
- Bookmark
- Subscribe
- Mute
- Subscribe to RSS Feed
- Permalink
- Report Inappropriate Content
Posted on 05-06-2020 08:33 AM
Darn, If you are pulling from /JSSResrouce/computers the data comes in as a nested object in computers.applications.application and I have been having a hard time wrangling this.
- Mark as New
- Bookmark
- Subscribe
- Mute
- Subscribe to RSS Feed
- Permalink
- Report Inappropriate Content
Posted on 05-11-2020 02:27 AM
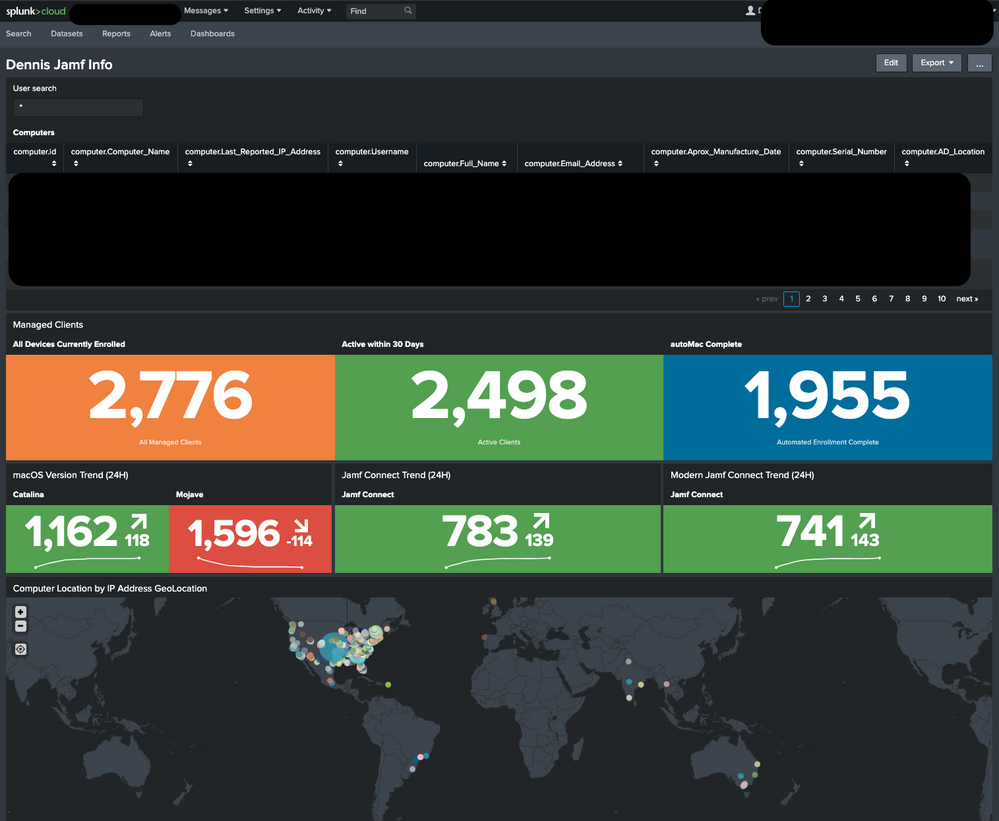
@ddcdennisb Just curious, where did you get those funky colour themes for Splunk?
- Mark as New
- Bookmark
- Subscribe
- Mute
- Subscribe to RSS Feed
- Permalink
- Report Inappropriate Content
Posted on 05-11-2020 04:25 AM
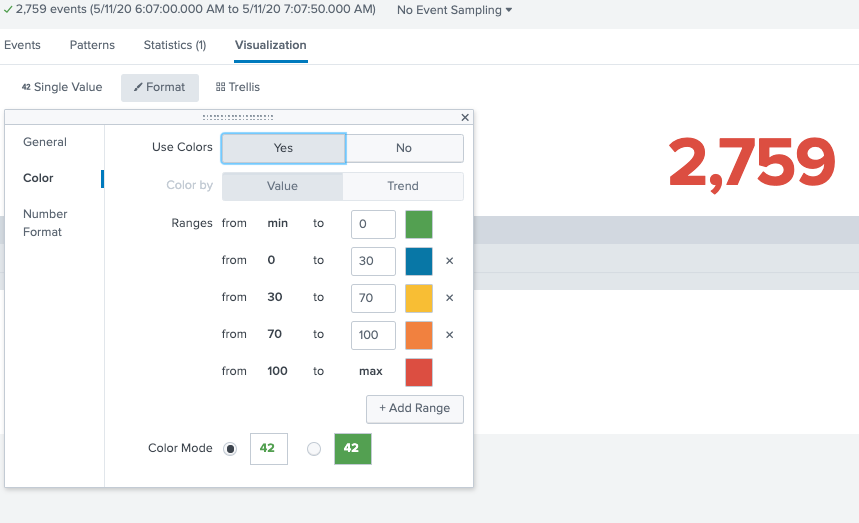
@txhaflaire are you talking about the colors used for the Numbered items like these?
- Mark as New
- Bookmark
- Subscribe
- Mute
- Subscribe to RSS Feed
- Permalink
- Report Inappropriate Content
Posted on 05-11-2020 04:28 AM
@ddcdennisb Exactly and can you share the query you use for the active within 30 days and inactive for 90+ days ?
- Mark as New
- Bookmark
- Subscribe
- Mute
- Subscribe to RSS Feed
- Permalink
- Report Inappropriate Content
Posted on 05-11-2020 05:04 AM
@txhaflaire For the colors, Its a single Value Visualization. When you looking at the format for it, you can Set colors for the values.
For the Active 30 Days and Inactive 90+, I have smart groups that are part of my Advanced search that Splunk reads its data from. So the search is like this:
index=app sourcetype=JamfModularInput computer.Computer_Group.Computer_Group_Membership.Group!="Out of Contact 30+"|rare limit=20000 "computer.name" | stats sum(count)and
index=app sourcetype=JamfModularInput computer.Computer_Group.Computer_Group_Membership.Group="Out of Contact 90+" | rare limit=20000 computer.name | stats sum(count)- Mark as New
- Bookmark
- Subscribe
- Mute
- Subscribe to RSS Feed
- Permalink
- Report Inappropriate Content
Posted on 05-11-2020 11:40 AM
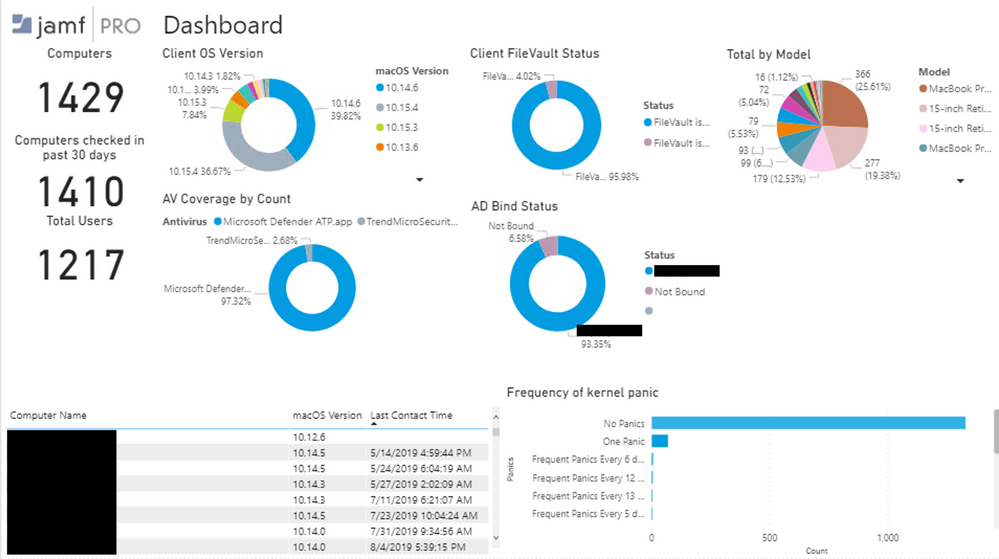
Here is one that I have been working on that is still growing. I'm using PowerBI for the reports using the published Jamf Pro PowerBI connector.
- Mark as New
- Bookmark
- Subscribe
- Mute
- Subscribe to RSS Feed
- Permalink
- Report Inappropriate Content
Posted on 07-26-2021 02:11 PM
Is this available as a template?
- Mark as New
- Bookmark
- Subscribe
- Mute
- Subscribe to RSS Feed
- Permalink
- Report Inappropriate Content
Posted on 09-19-2023 03:55 AM
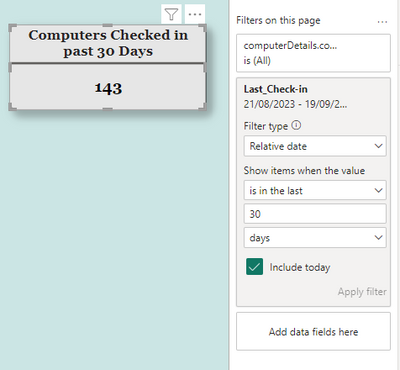
Hi, can you help me on computers checked in 20 days report as im struggling. I am using conector to connect Jamf on Powerbi.
- Mark as New
- Bookmark
- Subscribe
- Mute
- Subscribe to RSS Feed
- Permalink
- Report Inappropriate Content
Posted on 09-19-2023 06:52 AM
I think i have managed to get the filter. Looks like it is working but not sure if it is showing same devices checked in or not.
- Mark as New
- Bookmark
- Subscribe
- Mute
- Subscribe to RSS Feed
- Permalink
- Report Inappropriate Content
Posted on 09-19-2023 06:53 AM
I think I have managed to add the filter but when i add all computer count, it is showing same as last checked in filter.
- Mark as New
- Bookmark
- Subscribe
- Mute
- Subscribe to RSS Feed
- Permalink
- Report Inappropriate Content
Posted on 04-22-2024 01:49 AM
How have you been able to see the filter type for the relative date? I do not have this option.
- Mark as New
- Bookmark
- Subscribe
- Mute
- Subscribe to RSS Feed
- Permalink
- Report Inappropriate Content
Posted on 05-11-2020 11:59 AM
This search time regex worked for me for pulling the version of an application:
| rex "<Available_Update>Google Chrome.app</Available_Update><Application_Version>(?<Ex_Chrome_Version>[^<]*)"Basically says look for this string about Google Chrome, then grab everything after the "Application_Version" until you see a less than sign (which denotes the beginning of the end tag for "Application_Version"). Hop this helps you all in extracting versions.
- Mark as New
- Bookmark
- Subscribe
- Mute
- Subscribe to RSS Feed
- Permalink
- Report Inappropriate Content
Posted on 05-11-2020 12:16 PM
@bejohnson That looks great! I haven't even looked at using Splunk in my environment, but, the dashboard you have looks like something that would put permanent ear-to-ear grins on my Management.
Does anyone have any links to detailed instructions on how to install, configure, and, setup Splunk/dashboards? I would greatly appreciate it. Thanks!
- Mark as New
- Bookmark
- Subscribe
- Mute
- Subscribe to RSS Feed
- Permalink
- Report Inappropriate Content
Posted on 05-11-2020 12:37 PM
- Mark as New
- Bookmark
- Subscribe
- Mute
- Subscribe to RSS Feed
- Permalink
- Report Inappropriate Content
Posted on 05-11-2020 01:23 PM
Thank you @jamf_sam! I'm certainly going to look into it.
- Mark as New
- Bookmark
- Subscribe
- Mute
- Subscribe to RSS Feed
- Permalink
- Report Inappropriate Content
Posted on 05-12-2020 04:18 AM
@ddcdennisb Ah check! can you show screenshots of the Jamf Pro side, as i can't select in an Advanced Search to export the Computer Group, i can but only under the tab "Export Only".
Or did you create an particular Advanced Search with computers member of that group and create an new modular input in Splunk?
- Mark as New
- Bookmark
- Subscribe
- Mute
- Subscribe to RSS Feed
- Permalink
- Report Inappropriate Content
Posted on 05-12-2020 04:41 AM
@txhaflaire For my advanced search I used the "Export Only" checkbox for Computer Group. When Splunk pulls the data, the groups are in there.
- Mark as New
- Bookmark
- Subscribe
- Mute
- Subscribe to RSS Feed
- Permalink
- Report Inappropriate Content
Posted on 05-12-2020 02:08 PM
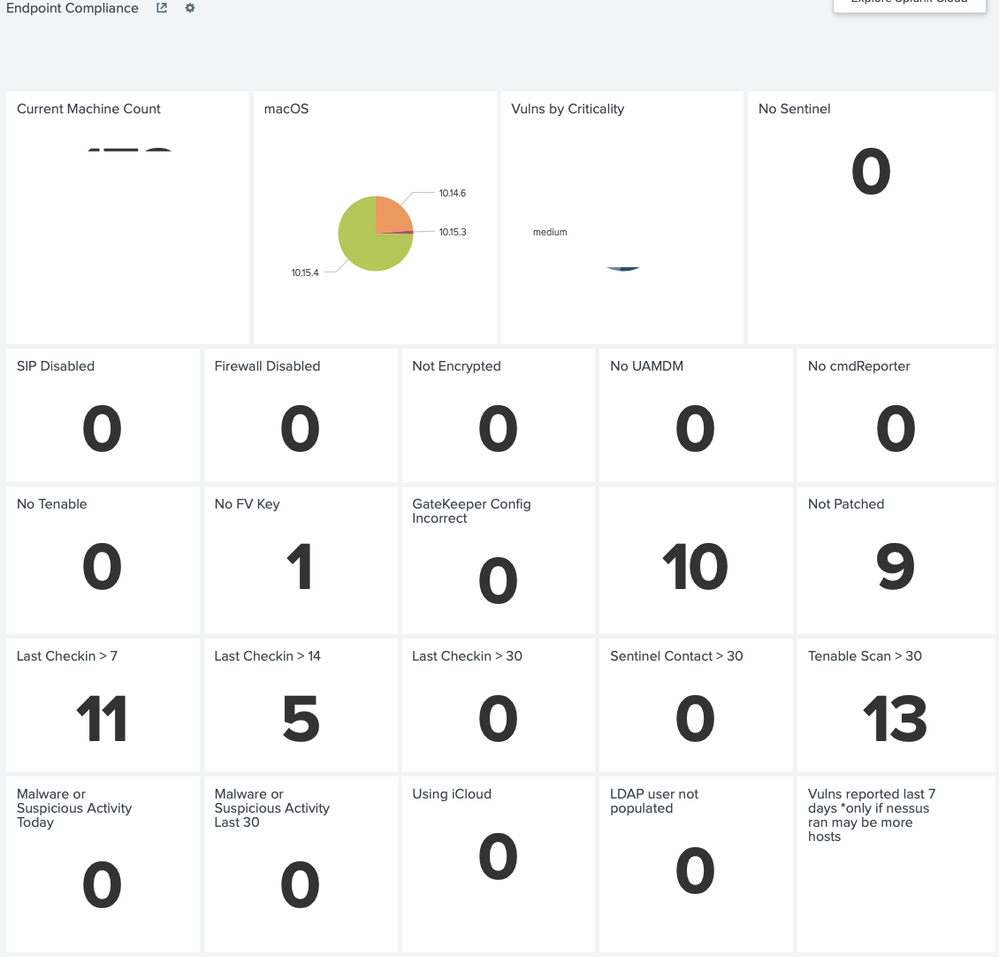
One of our dashboards... with redactions
- Mark as New
- Bookmark
- Subscribe
- Mute
- Subscribe to RSS Feed
- Permalink
- Report Inappropriate Content
Posted on 11-15-2022 04:55 PM
I have a couple of questions for you. How did you get the Tenable and "Not Patched" information?
- Mark as New
- Bookmark
- Subscribe
- Mute
- Subscribe to RSS Feed
- Permalink
- Report Inappropriate Content
Posted on 05-13-2020 06:00 PM
These are some great dashboards. @bejohnson , I see you're tracking frequency of Kernel Panics. How often is JAMF collecting inventory from your machines? weekly?
- Mark as New
- Bookmark
- Subscribe
- Mute
- Subscribe to RSS Feed
- Permalink
- Report Inappropriate Content
Posted on 05-20-2020 09:40 AM
@mgshepherd A python script is used as an Extension Attribute result so the output is due to the averaging of results in the script.
- Mark as New
- Bookmark
- Subscribe
- Mute
- Subscribe to RSS Feed
- Permalink
- Report Inappropriate Content
Posted on 07-21-2020 06:16 AM
@bejohnson What does your EA look like?
- Mark as New
- Bookmark
- Subscribe
- Mute
- Subscribe to RSS Feed
- Permalink
- Report Inappropriate Content
Posted on 07-22-2020 07:27 AM
I also would be interested in the EA if you can share since we would like to track KPs as well.
- Mark as New
- Bookmark
- Subscribe
- Mute
- Subscribe to RSS Feed
- Permalink
- Report Inappropriate Content
Posted on 07-22-2020 09:17 AM
- Mark as New
- Bookmark
- Subscribe
- Mute
- Subscribe to RSS Feed
- Permalink
- Report Inappropriate Content
Posted on 07-22-2020 04:03 PM
@bejohnson mind sharing how you configured that dashboard with PowerBI?
- Mark as New
- Bookmark
- Subscribe
- Mute
- Subscribe to RSS Feed
- Permalink
- Report Inappropriate Content
Posted on 07-22-2020 04:44 PM
@evaldes We just published a Power BI segment in our Jamf Pro Reporting Solution series on YouTube.
Here is a link to Part 1 for Power BI.
You can see an overview of all our reporting solution videos here.
- Mark as New
- Bookmark
- Subscribe
- Mute
- Subscribe to RSS Feed
- Permalink
- Report Inappropriate Content
Posted on 07-22-2020 04:58 PM
@jamf_sam thanks! I was in the web series at 6am lol... it sparked my interest doing the Reporting, and yeah I have been building the dashboard from scratch lately, and I'm no expert but having fun with this...
- Mark as New
- Bookmark
- Subscribe
- Mute
- Subscribe to RSS Feed
- Permalink
- Report Inappropriate Content
Posted on 07-22-2020 05:29 PM
Right on, thanks for joining @evaldes and we're excited to see what you come up with!
- Mark as New
- Bookmark
- Subscribe
- Mute
- Subscribe to RSS Feed
- Permalink
- Report Inappropriate Content
Posted on 09-06-2020 03:30 AM
We are currently looking into Splunk and seen how we might can use it.
We made a API check against /JSSResources/computers as in there learning videos.
I have seen @DBrowning did a lookup against group memberships. I wonder how/if this is working for the API lookup they do as well or is is more wise to create a new Source that uses a Search with the fields displaying we want?
Thanks
- Mark as New
- Bookmark
- Subscribe
- Mute
- Subscribe to RSS Feed
- Permalink
- Report Inappropriate Content
09-29-2020 06:20 PM - edited 11-09-2022 06:00 PM
There's a more verbose version of Jamf's Splunk Integration Guide available on Github. It goes into things like integrating data from multiple sources and more step by step on building searches than we wanted in the product documentation. And lots more screen-shots. :)
There are also some scripts there to pull things like mdm command history and application usage data that need some transformations that we haven't yet built into the standard plugin, and complete dashboards you can download as source code that you can just copy-paste into your Splunk. We'd love to see others share their dashboard code as well.
For those using PowerBI, this non-Jamf Blog is very helpful.
- Mark as New
- Bookmark
- Subscribe
- Mute
- Subscribe to RSS Feed
- Permalink
- Report Inappropriate Content
Posted on 11-09-2022 10:22 AM
@oliver can you post the verbose guide again as I can’t find it and the link is a 404
- Mark as New
- Bookmark
- Subscribe
- Mute
- Subscribe to RSS Feed
- Permalink
- Report Inappropriate Content
11-09-2022 05:58 PM - edited 11-09-2022 06:01 PM
Link updated.
- Mark as New
- Bookmark
- Subscribe
- Mute
- Subscribe to RSS Feed
- Permalink
- Report Inappropriate Content
Posted on 11-20-2020 05:58 AM
With Power Bi, has anyone found a way of filtering the results of last check in date so that it just highlights everything that hasn't checked in in greater than a certain period of time, such as hasn't checked in for more than 2 weeks?
- Mark as New
- Bookmark
- Subscribe
- Mute
- Subscribe to RSS Feed
- Permalink
- Report Inappropriate Content
Posted on 12-15-2020 07:57 AM
Hi,
Just started getting a Power BI dashboard together and its going pretty well.
Just wondered if anyone can help with one dashboard we really want to view.
I have 2 smart groups, one to show devices in the office and one to show devices out of office (WFH).
I want this to tick along daily/monthly showing a nice line graph of the change in numbers each day. So along the bottom of the graph would be the date and then device count up the side.
I cant for the life of me find a date field so this is impossible without it?!?! Any ideas?
- Mark as New
- Bookmark
- Subscribe
- Mute
- Subscribe to RSS Feed
- Permalink
- Report Inappropriate Content
Posted on 12-24-2020 08:29 AM
@AndrewShooter , you could set a "Active" column where it is True/False and then have where you have a slicer with the Active values and when someone interacts with it you can change the interaction from Filter to Highlight(I think that's the name) and it should highlight the items instead on that specific visual.
