Tomcat intermittently freezing

prodservices
New Contributor III

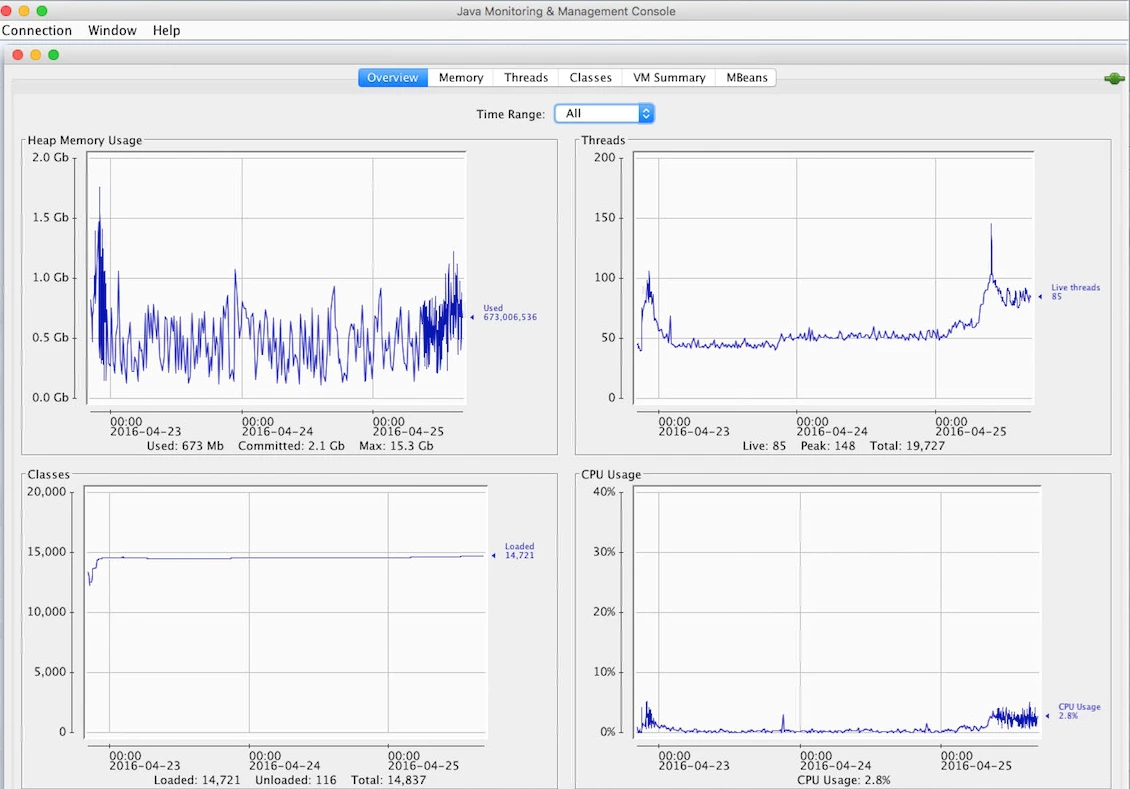
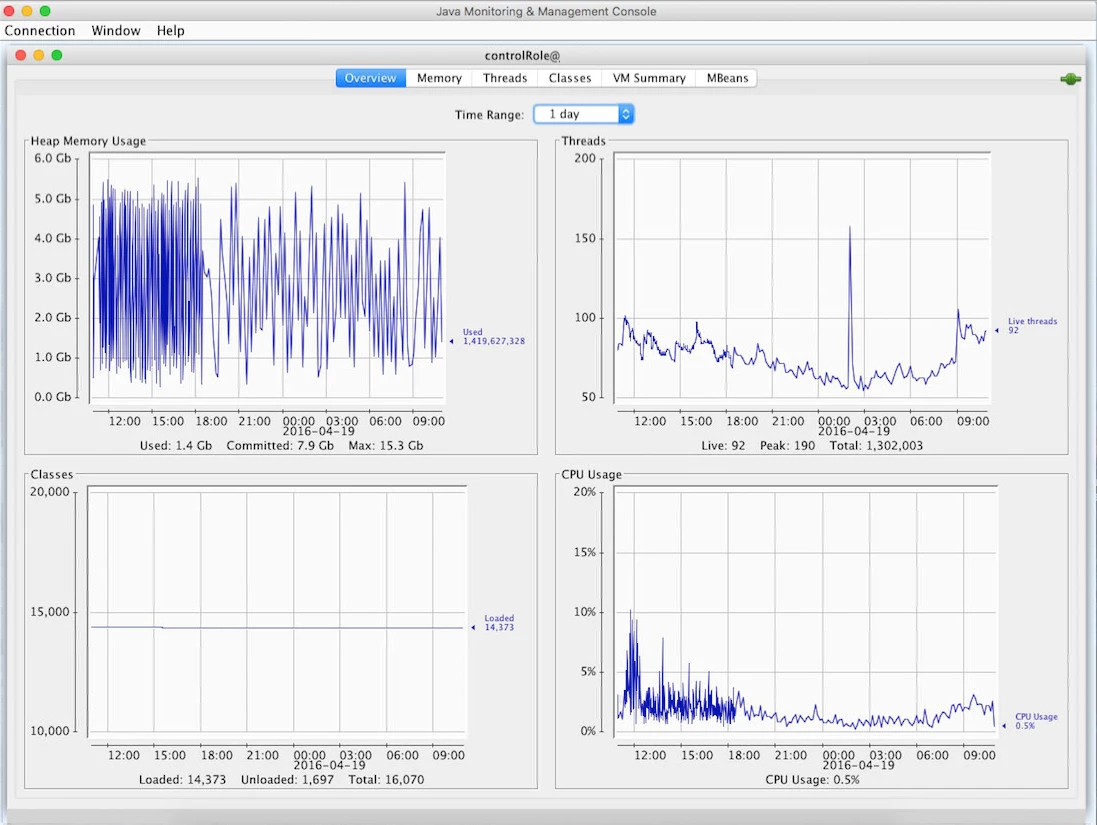
We have an issue where periodically (2-3x a month?) Tomcat will simply freeze up. The service is running but it stops responding. Restarting fixes this 100% of the time, so it's not impacting us greatly but I'm curious if anyone has seen something like this.

We're running v.9.92 on a physical server running RHEL 6.8 (Santiago) - server has plenty of memory (64gb) and storage (6 tb, less than 10% used currently).

8 REPLIES 8

jonnydford
Contributor II

We had a similar issue which froze Tomcat once a day related to our LDAP server not always connecting. It's unlikely to be that for you but go to your JSS url/logging.html and that may give you a better idea of whats happening.

I'd also turn on debug mode and send those logs to JAMF to look at.

Michael_Meyers
Contributor

Same thing is happening to us on our child JSS (JSS URL points here) for the past few weekends. I figured it was getting overwhelmed by my Office 2016 and Mac OS updates going out. Spoke with my JAMF STAM and was told to gather info when it happens again (screenshot, log from Mac, JAMFSoftwareServer.log from JSS, and send a JSS Summary). We know it is happening when Self Service cannot connect on Macs and iPads. Master JSS is still functioning normally.

ryanstayloradob
Contributor

How much memory is allocated specifically to Tomcat?

prodservices
New Contributor III

I don't believe we have allocated a specific amount of memory if I'm remembering correctly....

jchurch
Contributor II

we recently had two issues with our JSS. One was related to tomcat memory. our tomcat memory settings were lost. tomcat was only running with 256mb. we bumped it back up to 12gb and the jss started humming along again. the other was related to vpp licensing. when we removed our graduated students the JSS started revoking all the vpp apps but it hit a wall trying to revoke the ebooks. we got it running again and as long as we dont delete any users.

hope that helps

franton
Valued Contributor III

@prodservices My usual steps for troubleshooting Tomcat issues are as follows:

1) Check RAM available on server. (You've done this and you've more than enough)
2) Check RAM allocated to Tomcat. (Essential. Tomcat's defaults aren't good enough.)
3) Is the installed Java the recommended version for the JSS version you are running? (Java 1.8 now recommended for 9.93 onwards)
4) Is Tomcat the recommended version for your JSS version? (8.0.32 is now recommended for 9.93)
5) Is the MySQL server the recommended version? (Now using 5.6 for 9.93 onwards).

I've found it pays immensely to keep to JAMF's recommended versions. Above or below causes issues, which I learnt the hard way.

The Tomcat memory allocation is the nasty part, and this is covered as part of JAMF's CJA certification. I automated a lot of this in my JSS in a Box script. The relevant section of code you can find here (along with a bunch of server.xml initial configuration stuff which is semi relevant).

@rtrouton has a good guide on the basics here

Olivier
New Contributor II

We had similar issues in the past (maybe once per year...), and most of them were happening only few day after we upgraded JSS to new version or so... Being tired of this, we have configured JMX monitoring for the JSS Tomcat instance (with "controlRole"), and now start "jconsole" during few days before and after an upgrade, to see how trends change over the time.

I attached a graph after we upgraded to 9.91, and the load we saw on server shortly after bringing it back online (before midnight 23rd), and the load on monday morning when people go to office (spike at 150 threads). The other graph with 9.73 looks very different (the one from 19th April) : here we saw permanent spikes to 6GB of memory heap all the time, but no idea why shape of curve changed so drastically... The spike at 2.00am (CET) to 160 threads, is when we do our nightly DB backup, so if you believe your thread limit is maybe 100 during the day and configured it in the server.xml, take also into account when a DB backup is made...

Unfortunately, as we didn't experienced any hang problem since maybe 1 or 2 years, I don't have anymore reference graphs where Tomcat hanged for real. However, we noticed during one Tomcat freeze, that SQL connections went to up to our configured limit : more than 500 connections, while maximum value we have seen in production is under 200 (usually the number is approx 40/50 during few months) : this probably means sth entered in a kind of loop, as MySQLd was perfectly still running...

Every time we looked into JSS server logs, there was nothing interesting being logged (probably because Tomcat hanged, so it could not write logs...), while JMX still runs even if JSS hanged :-).

So do not underestimate the amount of heap RAM you need for Java Xmx variable, or thread limit, as it is difficult to catch such short-living spikes...especially when they drastically change from version to version.

67dee925a8ff4f718977c71361359851
43efb969c3b94cd3b162160cb9e8cad2

(note : I am not a dev guy, nor understand any Java internals...)

davidacland
Honored Contributor II

We're an MSP and have seen regular tomcat crashes in lots of places. In almost every case it's been a lack of memory for the process.

You can get an idea by going to settings and JSS information in the web interface. This will tell you how much ram is available and how much is being used.

Linux handles memory allocation quite differently from Windows so there is a bit more manual tweaking to do in that case.

It is still worth checking to see if there's a pattern to the crashing though before throwing more memory at it, in case it's a policy or process that's causing the overload.